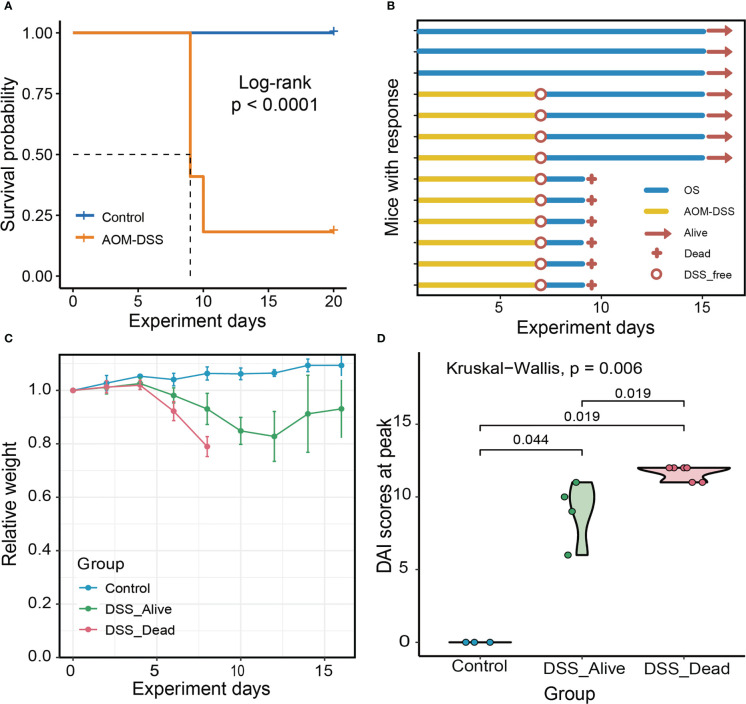
Figure 1.
Experiment overview and mice characteristics of the three group. (A) Survival plot of AOM-DSS treated mice and control. (B) Experimental protocols, progress and results for Control group, DSS_Alive group and DSS_Dead group. (C) Changes in body weight of the three group as the experiment was conducted over time. (D) Violin plot of the highest DAI score of the three group. Kruskal-Wallis test was used to tested the differences of the DAI scores at peak in three groups.

