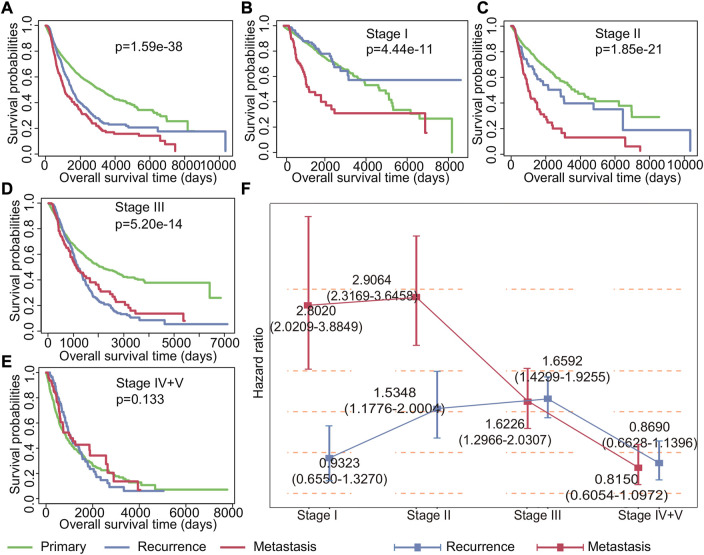
FIGURE 2.
Impact of recurrence and metastasis on patients’ survival in various stages of cancer. (A) Kaplan–Meier survival curves of all patients with primary, recurrent, and metastatic tumors. (B–E) Kaplan–Meier survival curves of patients with primary tumors, recurrent tumors, and metastatic tumors in stages I, II, III, and IV + V. (F) Cox regression analysis of the impact of recurrence and metastasis on each stage patients’ survival. The point represents the risk ratio, and the line segment represents the 95% confidence interval.

