FIGURE 4.
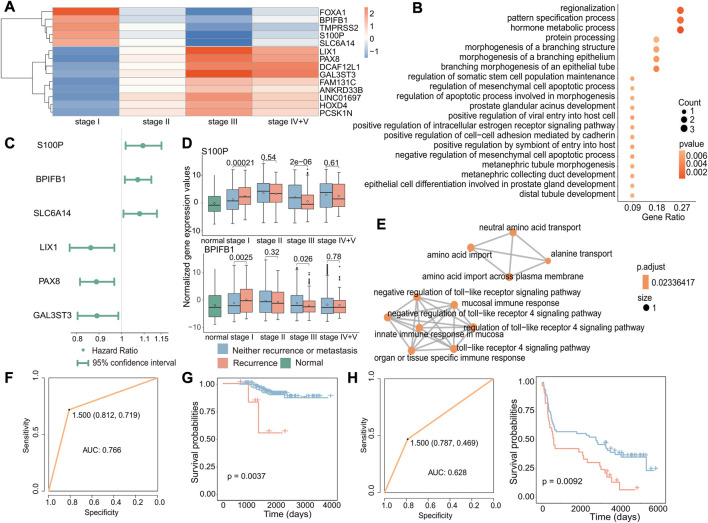
Biomarkers associated with early recurrence in cancer. (A) Heatmap of fold-change values of stage-specific differentially expressed genes in stage I. Red indicates that gene expression was upregulated in recurrent tumors, while blue indicates downregulation in recurrent tumors. (B) GO enrichment analysis of stage-specific differentially expressed genes in stage I. The size of the dot indicates the number of genes involved in the pathway, and the color of the dot indicates the p-value. (C) Cox regression analysis of stage I-specific differentially expressed genes related to prognosis. The point is the value of the hazard ratio, and a value greater than 1 indicates that it was related to poor prognosis. (D) Boxplot of the expression of S100P and BPIFB1 in normal, primary, and recurrent tumor samples. (E) GO enrichment analysis of three genes. Each dot represented a pathway, and the connecting two points meant that the same genes were in the pathways. (F) Based on these three genes, the ROC curve of the classifier constructed by the support vector machine method. (G) For the GSE31210 dataset, the Kaplan–Meier survival curve of the SVM classification result. Red indicated samples predicted to have recurrence, and blue indicated samples predicted to have no recurrence. (H) For the GSE37745 dataset, the ROC curve of the k-nearest neighbor classifier (left) and the survival curve of the classification result (right). Red indicates samples predicted to have recurrence, and blue indicates samples predicted to have no recurrence.

