Table 2.
Optimization of P5

|
EC50 (μM) |
β5 IC50 (μM) | Permeability | Metabolic stability m/hLM Clint | Kinet. Solu. | Cyto- tox. | cLogP | |||||
|---|---|---|---|---|---|---|---|---|---|---|---|---|
| ID | P1 | P2 | 3D7 | Pf20S | c-20S | i-20S | PAMPA | Ratio /MDR1 | ||||
| 9 | A |
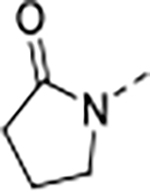
|
0.010 | 0.095 | 1.5 | 9.6 | 30 | 26/1 | 73.9/15.5 | >140 | 97 | 4.0 |
| 12 | A |
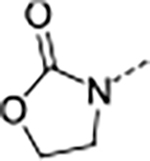
|
0.013 | 0.034 | 23.0 | >100 | 10 | >8/<1 | 112/16 | 65 | 4.1 | |
| 13 | B |
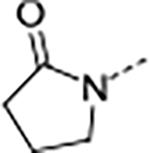
|
0.073 | 0.21 | 33.5 | 88.0 | <1 | >1/<1 | 203/54 | >150 | 3.2 | |
| 14 | B |
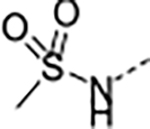
|
>2.8 | 2.0 | >100 | >100 | <1 | N.D. /<1 | 19/6 | >140 | 2.7 | |
| 15 | B |
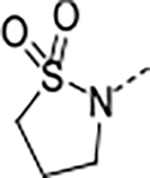
|
0.085 | 0.46 | >100 | 59.8 | <2 | >0.5/<2 | 8/34 | >140 | 3.1 | |
PAMPA unit: nm/sec at pH7.4; MDR unit: ratio (B→A/A→B); A→B, nm/sec; Metabolic stability m/hLM Clint: mouse / human liver microsomes and unit- μL/min/mg; Kinet. Solu.: Kinetic solubility at pH6.8 (μg/mL); Cytotox.: cytotoxicity, % viability of HepG2 cells at 30 μM. “-”: not tested.
