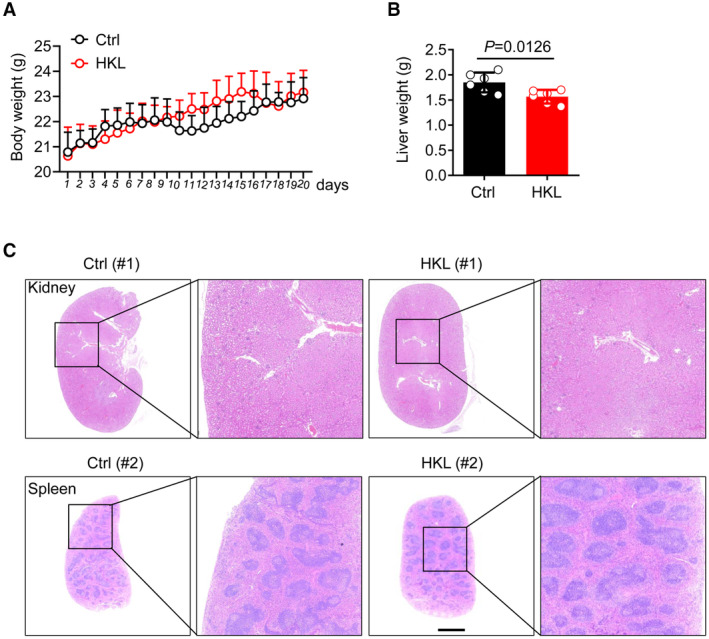
Figure EV5. HKL treatment did not cause pathological damage in the kidney or spleen in vivo .

- Body weight of individual mice from the control group and HKL group from day 1 to day 20. The results are expressed as mean ± SD (n = 6). Data are representative of three biological replicates.
- Quantification of liver weight in mice from the control group and HKL group at autopsy on day 20. The results are expressed as mean ± SD (n = 6); Unpaired t‐test. P‐value was described in the figure.
- Representative hematoxylin and eosin (H&E) staining of harvested kidney tissues (above), and spleen tissues (below) from the control group and HKL group. Scale bars, 5 mm. Data are representative of three independent experiments.
