
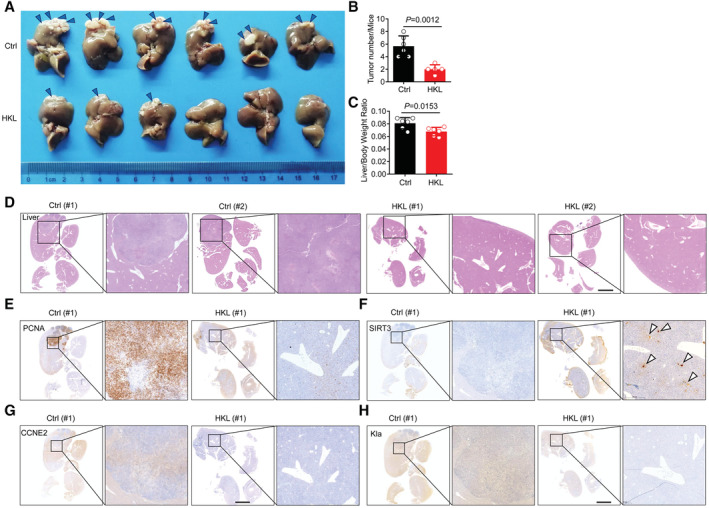
Figure 7. HKL treatment activates SIRT3 to prevent HCC outgrowth in vivo .
-
ARepresentative pictures of HCC on day 21 from control mice (above) and mice treated with HKL (below). n = 6 for each group. The arrowheads show the area where the tumor is growing. Data are representative of three independent experiments.
-
B, CQuantification of liver tumor number (B) as well as liver/ body weight ratio (C) in mice from the control group and HKL group at autopsy on day 20. The results are expressed as mean ± SD (n = 6); Unpaired t‐test. P‐value was described in the figure.
-
DRepresentative hematoxylin and eosin (H&E) staining of harvested liver tissues from the control group and HKL group. Scale bars, 5 mm. Data are representative of three independent experiments.
-
E–HRepresentative images of immunohistochemistry (IHC) staining of PCNA (E), SIRT3 (F), CCNE2 (G) and Kla (H) in liver tissue sections of mice from the control group and HKL group. Scale bars, 5 mm. Data are representative of three independent experiments.