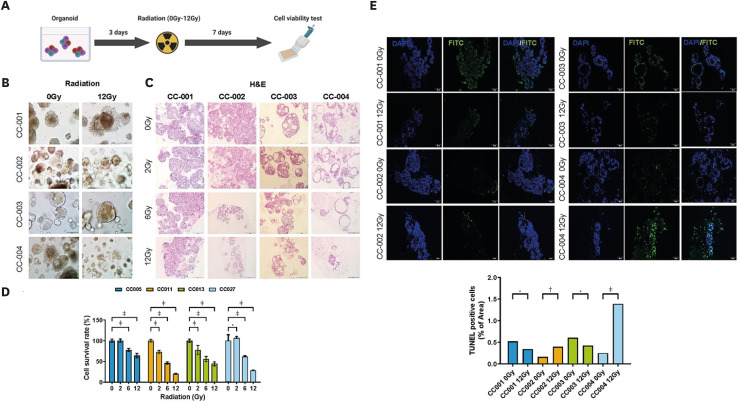
Fig. 5. Cell survival of human cervical cancer organoids after irradiation. (A) Schematic diagram of the irradiation procedure of cervical organoids. (B) Brightfield image of PDOs treated with 2 points (0, 12 Gy) of radiation. (C) PDOs are treated with indicated doses (0/2/6/12 Gy) of radiation, followed by H&E staining. Scale bars, 200 μm (magnified images). (D) Cell viability of PDOs according to radiation dose (0/2/6/12 Gy). Data are expressed as the mean ± standard deviation.
Gy, gray; H&E, hematoxylin and eosin; PDO, patient-derived organoid.
*p=0.010–0.050; †p=0.001–0.010; ‡p<0.001.

