. 2023 Feb 14;22(5):599–615. doi: 10.1158/1535-7163.MCT-21-0880

Figure 3.

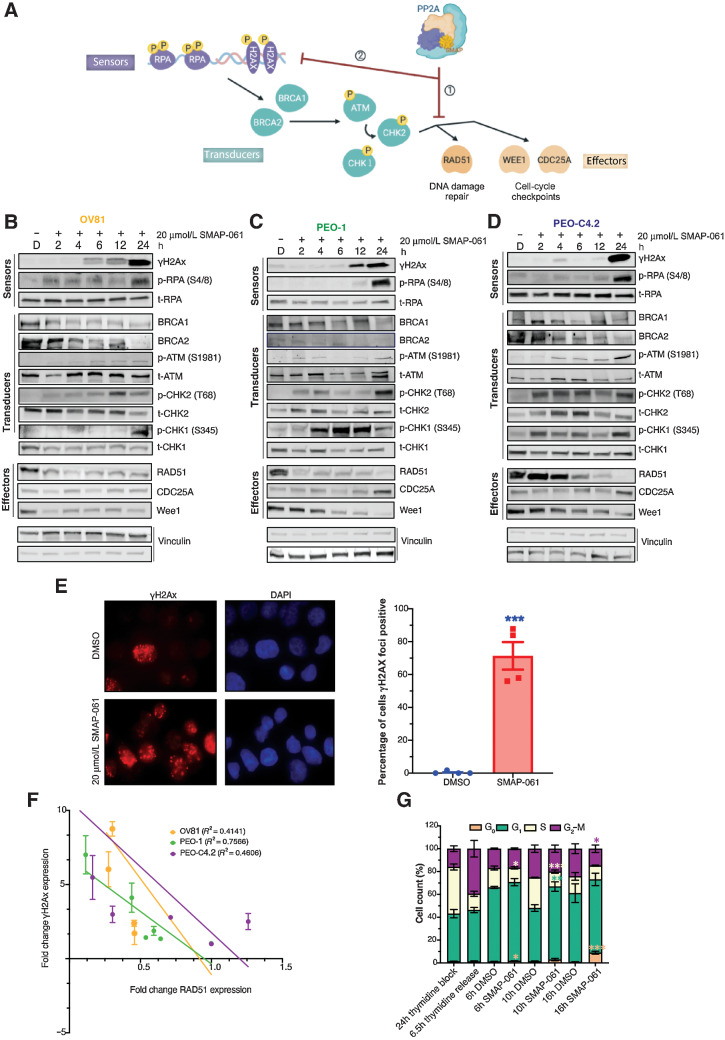
Figure 3. SMAP-061–induced baseline DNA damage accumulation is a result of the inhibition of HR signaling output, including DNA damage repair and cell-cycle regulation mechanisms. A, Schematic of the HR pathway, representing the DNA sensors (RPA and H2Ax) that detect damage, the transducers (BRCA1/2, ATM, and CHK1/2) that can amplify and transmit those damage signals to the effectors (RAD51, WEE1 and CDC25A), which ultimately regulate DNA damage repair and cell-cycle checkpoint activity. Ultimately, when the HR output is successfully transmitted to the sensors by RAD51, HGSC baseline DNA damage is kept low and homeostasis is restored, allowing cells to survive long-term with inherent DNA errors due to genomic instability (GI). However, when SMAPs are added, PP2A gets activated, allowing for (i) RAD51 expression to be inhibited and leading (ii) to the HR effectors’ function to be chronically impaired. This results in the incapacity of the cells to restore cell-cycle progression and DNA damage repair, eventually dying to self-triggered apoptosis (Schematic created with BioRender.com). Western blot analysis of (B) OV81, (C) PEO-1, and (D) PEO-C4.2 cells after 2, 4, 6, 12, and 24 hours of SMAP-061 treatment evaluates the expression of sensor, transducer, and effector proteins illustrated in the schematic of A. E, γH2Ax foci imaging comparing DMSO and 20 μmol/L SMAP-061–treated OV81 cells after 12-hours of incubation and their respective quantification. Data presented as the mean ± SEM (n = 3; unpaired Student t tests, comparing the SMAP-061 treatment group relative with DMSO; ***, P < 0.001). F, Correlation analysis graph and R2 values comparing the expression of RAD51 with γH2Ax in OV81, PEO-1 and PEO-C4.2 during 2, 4, 6, 12, and 24 hours of SMAP-061 treatment. Data presented as the mean ± SEM (n = 3). G, Statistical and quantification analysis of cell-cycle flow (from Supplementary Fig. S2O) for cells after incubation with 2 mmol/L thymidine for 24-hours (first bar), at 6.5 hours thymidine released (to allow cells to reengage cell-cycle progression; second bar), and consecutive treatments with either DMSO or SMAP-061 for 6 hours (third and fourth bars), 10 hours (fifth and sixth bars), and 16 hours (seventh and eighth bars), respectively, using FlowJo. Data presented as the mean ± SD (n = 3; unpaired Student t tests, comparing treatment groups with each other, for each stage of the cell-cycle, *, P < 0.05; **, P < 0.01; ***, P < 0.001).

SMAP-061–induced baseline DNA damage accumulation is a result of the inhibition of HR signaling output, including DNA damage repair and cell-cycle regulation mechanisms. A, Schematic of the HR pathway, representing the DNA sensors (RPA and H2Ax) that detect damage, the transducers (BRCA1/2, ATM, and CHK1/2) that can amplify and transmit those damage signals to the effectors (RAD51, WEE1, and CDC25A), which ultimately regulate DNA damage repair and cell-cycle checkpoint activity. Ultimately, when the HR output is successfully transmitted to the sensors by RAD51, HGSC baseline DNA damage is kept low and homeostasis is restored, allowing cells to survive long-term with inherent DNA errors due to genomic instability (GI). However, when SMAPs are added, PP2A gets activated, allowing for (i) RAD51 expression to be inhibited and (ii) leading to the HR effectors’ function to be chronically impaired. This results in the incapacity of the cells to restore cell-cycle progression and DNA damage repair, eventually dying to self-triggered apoptosis (schematic created with BioRender.com). Western blot analysis of OV81 (B), PEO-1 (C), and PEO-C4.2 (D) cells after 2, 4, 6, 12, and 24 hours of SMAP-061 treatment evaluates the expression of sensor, transducer, and effector proteins illustrated in the schematic of A. E, γH2Ax foci imaging comparing DMSO and 20 μmol/L SMAP-061–treated OV81 cells after 12 hours of incubation and their respective quantification. Data presented as the mean ± SEM (n = 3; unpaired Student t tests, comparing the SMAP-061 treatment group relative with DMSO; ***, P < 0.001). F, Correlation analysis graph and R2 values comparing the expression of RAD51 with γH2Ax in OV81, PEO-1, and PEO-C4.2 during 2, 4, 6, 12, and 24 hours of SMAP-061 treatment. Data presented as the mean ± SEM (n = 3). G, Statistical and quantification analysis of cell-cycle flow (from Supplementary Fig. S2O) for cells after incubation with 2 mmol/L thymidine for 24 hours (first bar), at 6.5 hours thymidine released (to allow cells to reengage cell-cycle progression; second bar), and consecutive treatments with either DMSO or SMAP-061 for 6 hours (third and fourth bars), 10 hours (fifth and sixth bars), and 16 hours (seventh and eighth bars), respectively, using FlowJo. Data presented as the mean ± SD (n = 3; unpaired Student t tests, comparing treatment groups with each other, for each stage of the cell-cycle, *, P < 0.05; **, P < 0.01; ***, P < 0.001).