Figure 6.
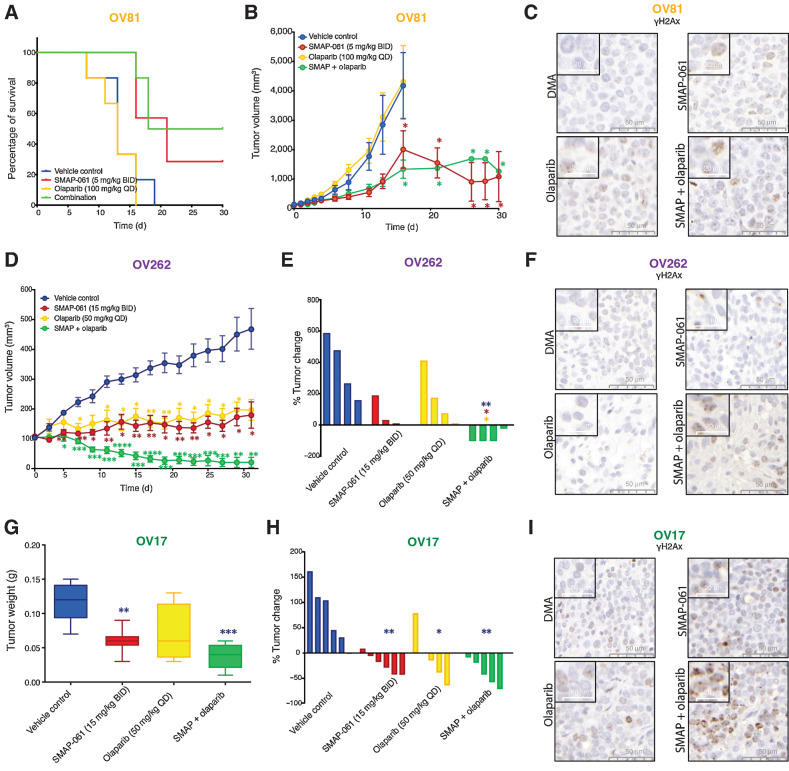
Effects of SMAP-061 in vivo show improved survival and significant tumor regression, as a single agent and in combination with PARPi, in both BRCA1/2 wild-type and mutant HGSC PDX tumors. OV81 PDX studies were conducted with tumors implanted in the right flank of NSG mice and allowed to grow between approximately 100 and 200 mm3 before enrollment in one of 4 treatment groups: Vehicle control (n = 6), 5 mg/kg SMAP-061 (n = 6), 100 mg/kg olaparib (n = 6), or SMAP + olaparib combination (n = 6). Tumors were measured every other day. Data plotted as a function of mouse survival (A) and tumor volume (efficacy; B) over time. Survival threshold was selected to be 1,000 mm3 (tumors < 1,000 mm3: survival; tumors > 1,000 mm3: no survival). Data presented as mean ± SEM (Student t tests, comparing each treatment group relative with vehicle control; *, P < 0.05). C, Histology slides with tumor samples stained for γH2Ax (brown), representative of each individual treatment group in the OV81 PDX in vivo study. 50- and 20-µm scales are included for each respective picture. D, Efficacy study of OV262 PDX tumors, implanted in the right flank of NSG mice and allowed to grow between approximately 90–120 mm3 before enrollment in one of 4 treatment groups: vehicle control (n = 4), 15 mg/kg SMAP-061 (n = 3), 50 mg/kg olaparib (n = 4), or SMAP + olaparib combination (n = 4). Tumors were measured every other day. Tumor volume was calculated and plotted over time (31 days). Data presented as mean ± SEM (Student t tests, comparing each treatment group relative with vehicle control, *, P < 0.05; **, P < 0.01; ***, P < 0.001; ****, P < 0.0001). E, Waterfall plot of OV262 tumor volume change (from days 0 to 31) comparing all treatment groups with each other. Data presented as mean ± SEM (unpaired Student t tests, comparing each individual treatment group relative with each other, *, P < 0.05; **, P < 0.01). F, Histology slides with tumor samples stained for γH2Ax (brown), representative of each individual treatment group in the OV262 PDX in vivo study. 50- and 20-µm scales are included for each respective picture. G and H, OV17 PDX studies were conducted with tumors implanted in the right flank of NSG mice and allowed to grow between approximately 80 and 250 mm3 before enrollment in one of 4 treatment groups: vehicle control (n = 6), 15 mg/kg SMAP-061 (n = 6), 50 mg/kg olaparib (n = 5), or SMAP + olaparib combination (n = 5). Tumors were measured every other day. Data plotted as a function of tumor weight post sacrifice (G) and tumor change percentage (waterfall plot; H) for each treatment group. Data presented as mean ± SEM (unpaired Student t tests, comparing each individual treatment group relative with each other, *, P < 0.05; **, P < 0.01; ***, P < 0.001). I, Histology slides with tumor samples stained for γH2Ax (brown), representative of each individual treatment group in the OV17 PDX in vivo study. 50- and 20-µm scales are included for each respective picture.

