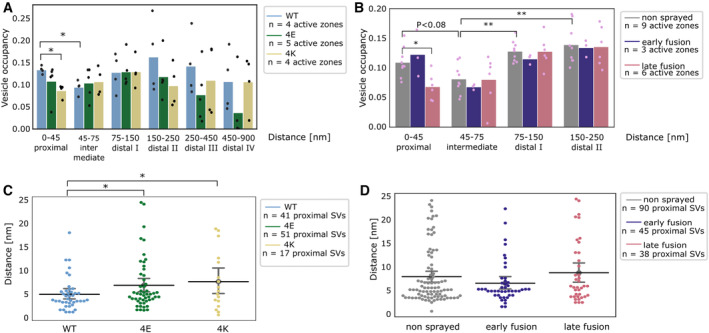
Figure 4. SV distribution.

-
A, BVesicle occupancy expressed as fraction of cytosol volume occupied by vesicles as a function of distance to AZ in (A) cultured neurons and (B) synaptosomes. Each bar is the average value of a distance group of all tomograms of the same treatment/genotype. Each dot represents the occupancy of a distance group in a single tomogram. Statistical test: multiple all against reference pairwise ANOVA comparisons with Benjamini–Hochberg correction. *P < 0.05 and **P < 0.01 after Benjamini–Hochberg correction. The reference distance group was the intermediate one. The reference experimental conditions were the WT genotype (A) and non‐sprayed synaptosomes (B), respectively. Comparisons between distance groups were performed only within the reference experimental conditions.
-
C, DDistance of proximal SVs from the AZ. Each dot represents the value of an individual SV. Horizontal line: mean; whiskers: 2×SEM interval. Statistical test: multiple all‐against‐reference pairwise ANOVA comparisons with Benjamini–Hochberg correction; *P < 0.05 after Benjamini–Hochberg correction.
