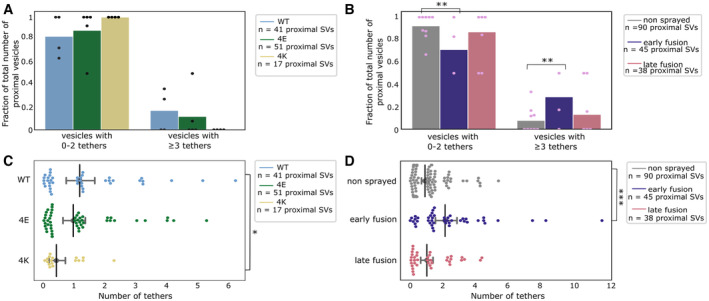
Figure 5. Proximal SV tethering.

-
A, BFraction of proximal SVs that are triple tethered. Each bar shows the overall fraction of all proximal SVs from a given experimental condition. Each dot represents the value of an individual active zone. Statistical test: multiple all‐against‐control pairwise χ2‐test comparisons with Benjamini–Hochberg correction. **P < 0.01 after Benjamini–Hochberg correction. The reference was the WT genotype (A) or non‐sprayed synaptosomes (B).
-
C, DNumber of tethers per proximal SV. Each dot represents an individual SV. The vertical line represents the mean value, and the horizontal whiskers correspond to the 95% confidence interval. Statistical test: multiple all‐against‐control pairwise ANOVA comparisons with Benjamini–Hochberg correction; *P < 0.05 and ***P < 0.001, after Benjamini–Hochberg correction.
