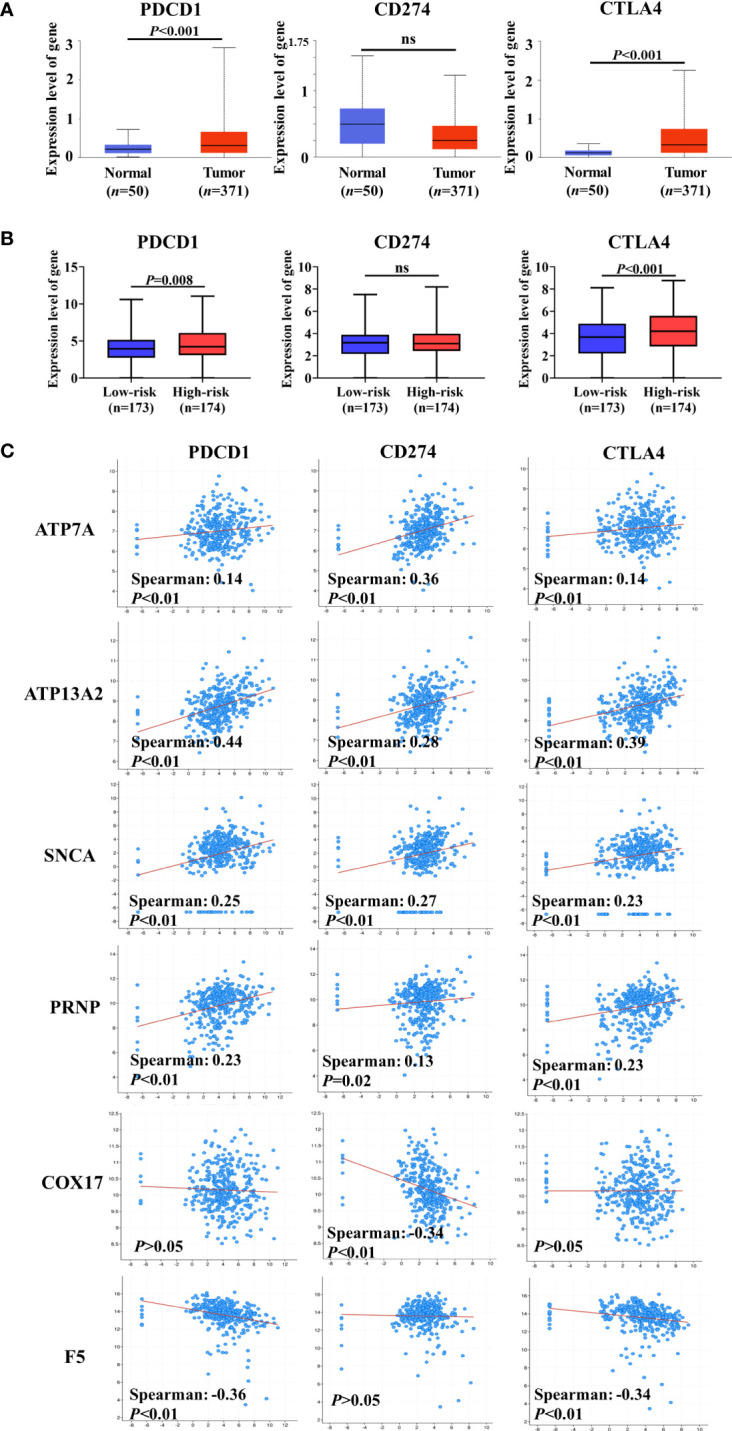
Figure 6.

Co-expression analysis of cuproptosis-related genes (CRGs) and immune checkpoint genes (ICGs). (A) Expression levels of ICGs between normal liver tissue and hepatocellular carcinoma (HCC). (B) Differences in the expression of ICGs between low-risk and high-risk groups. (C) Co-expression analysis of CRGs and ICGs. ATP7A, ATP13A2, and SNCA were significantly positively correlated with the expression of ICGs, and a negative correlation between ICGs and COX17 or F5 was observed. ns, no significance.
