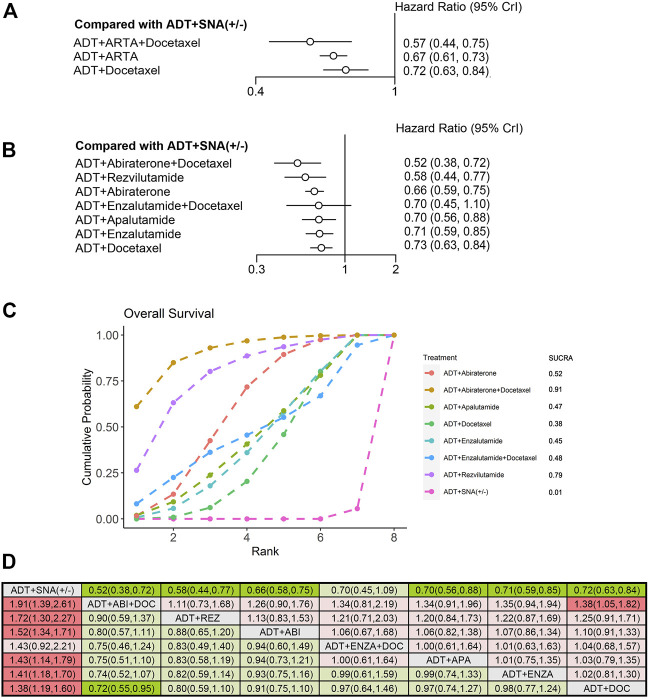
FIGURE 4.
Comparison of therapies for improving OS in patients with high-volume disease. (A) Forest plot representing HR for combination therapy compared with ADT with or without SNA. (B) Forest plot representing HR for specific therapy compared with ADT with or without SNA. (C) SUCRA plot showing the treatment ranking of specific therapies. (D) League table of NMA comparing the OS. Comparison is located at the intersection of the column-defining treatment and the row-defining treatment. The results are presented in HR with 95% CrI. HR > 1 (red) favors row-defining treatment, and HR < 1 (green) favors column-defining treatment. The dark red or green represents the results with statistical significance. DOC, Docetaxel; ABI, Abiraterone, ENZA, Enzalutamide; APA, Apalutamide; REZ, Rezvilutamide; OS, overall survival; ADT, androgen deprivation therapy; SNA, standard non-steroidal antiandrogen; HR, hazard ratio; NMA, network meta-analysis; SUCRA, surface under the cumulative ranking curve.

