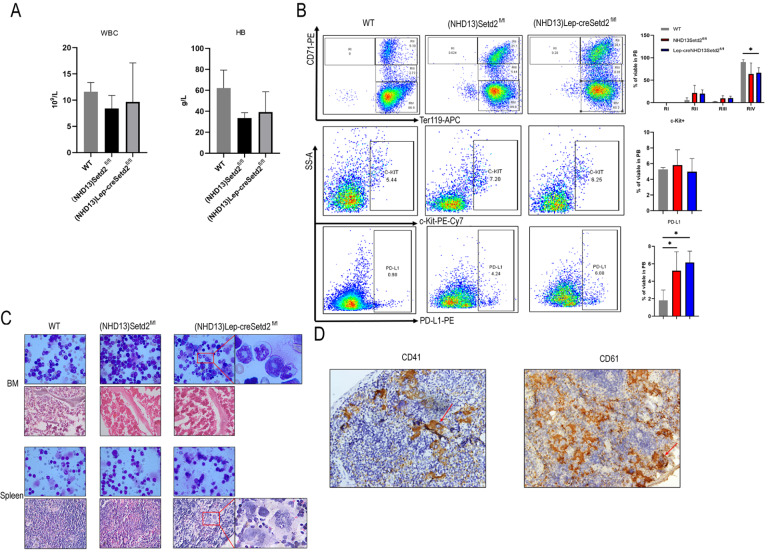
Figure 4 .
PD-L1 is increased in (NHD13)Setd2 fl/fl transgenic and (NHD13)Lep-creSetd2 fl/fl transgenic mice
(A) Complete blood count (CBC) analysis of WT, (NHD13)Setd2 fl/fl and (NHD13)Lep-creSetd2 fl/fl mice. CBCs were obtained 3 months after transplantation. RBC, hemoglobin. (B) Representative flow cytometry profiles and quantification of the frequencies of the peripheral blood (PB) cells of the WT, (NHD13)Setd2 fl/fl and (NHD13)Lep-creSetd2 fl/fl mice at the indicated erythroid differentiation stages (RI, proerythroblasts; RII, basophilic erythroblasts; RII, chromatophilic erythroblasts; RIV, orthochromatophilic erythroblasts). Representative flow cytometry profiles and quantification of the frequencies of c-kit+ cells in the PB of the indicated mice at 3 months after transplantation. Representative flow cytometry profiles and quantification of the frequencies of PD-L1+ cells in the PB of the indicated mice at 3 months after transplantation. (C) Wright’s staining of BM and spleen cells isolated from mice transplanted for 3 months (100×magnification). Hematoxylin and eosin staining of the BM and spleen of the mice transplanted for 3 months (40×magnification). (D) Immunohistochemistry of spleen of the (NHD13)Lep-creSetd2 fl/fl mice transplanted for 3 months (40×magnification) in CD41 and CD61. Data are expressed as the mean±SD from three experiments. * P<0.05.

