Figure 1 .
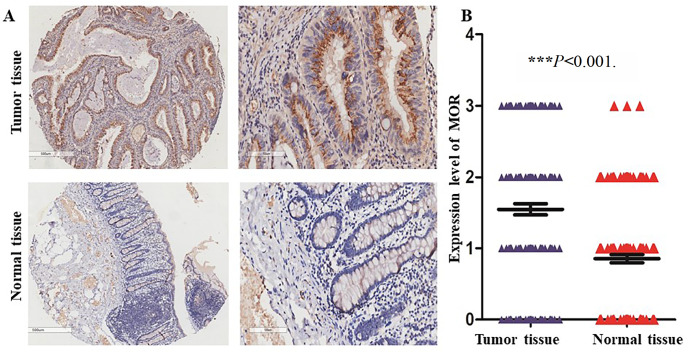
Overexpression of MOR in CRC tumor tissues
(A) Representative images of MOR expression of paired normal and tumor tissues (original magnification: × 40 for the left two images, and × 200 for the right two images). (B) Based on the expression intensity of MOR, 180 patients were divided into 4 groups: strong (score=3), moderate (score=2), weak (score=1) and negative (score=0). *** P<0.001.

