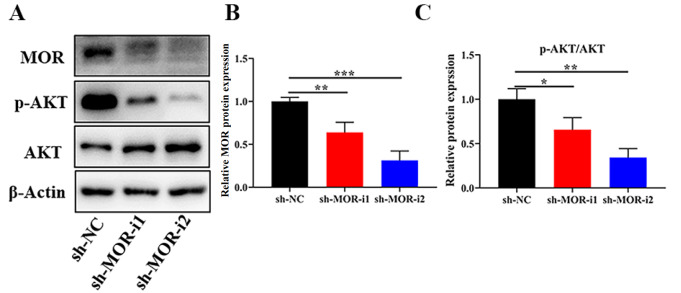
Figure 5 .
Impact of MOR silencing on PI3K/AKT pathways
(A) Representative western blots showing the expressions of MOR and p-AKT after transfection with sh-MOR in CRC cells. (B,C) The relative expression level was shown. * P<0.05, ** P<0.01, and *** P<0.001.

