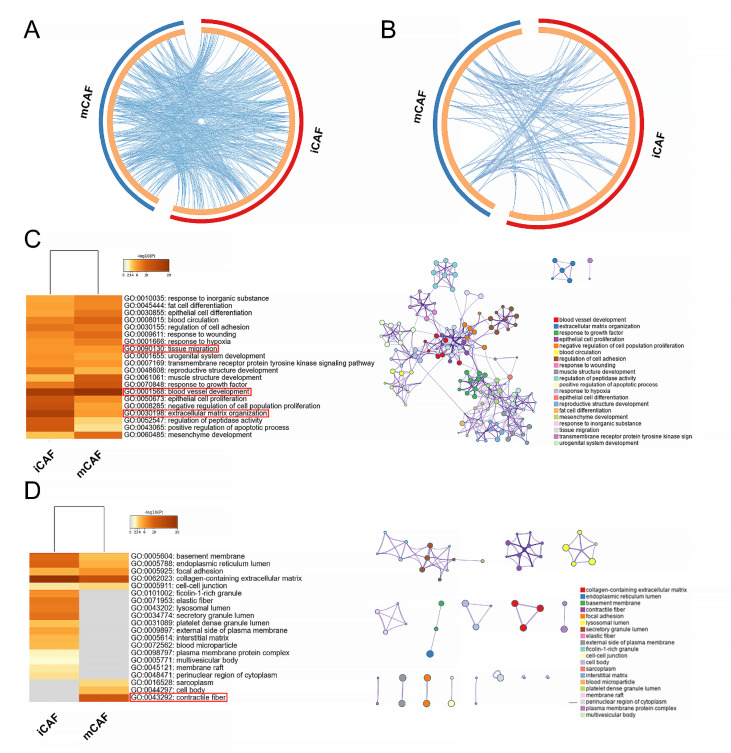
Figure 3 .
GO enrichment analysis of iCAFs and mCAFs
The Circos plot shows how differentially upregulated genes between two CAF subtypes overlap in GO biological process (A) and cellular component (B). On the outside, each arc represents the identity of each gene list. On the inside, each arc represents a gene list, where each gene has a spot on the arc. Blue lines link the different genes where they fall into the same ontology term, indicating the amount of functional overlap among the input gene lists. (C) GO biological process enrichment analysis of iCAFs and mCAFs with a network of representative terms shown on the right. (D) GO cellular component enrichment analysis of iCAFs and mCAFs with a network of representative terms shown on the right.

