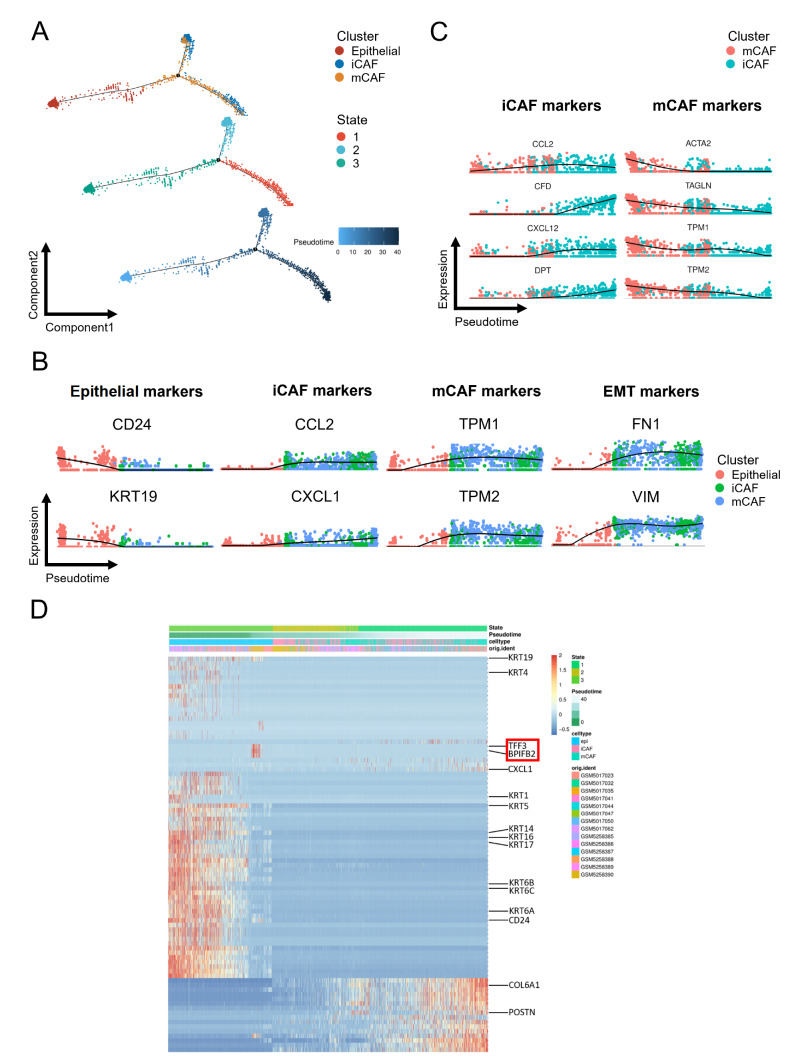
Figure 4 .
Pseudotime analysis of epithelial, iCAF and mCAF populations
(A) Trajectory order of epithelial, iCAF and mCAF populations colored by cell type, state and pseudotime. (B) Relative expression alteration of marker genes for epithelial, iCAF, mCAF and EMT across pseudotime. (C) Relative expression alteration of marker genes for iCAF and mCAF populations across pseudotime. (D) Heatmap of differentially expressed genes ordered by state, pseudotime, cell type and patient.

