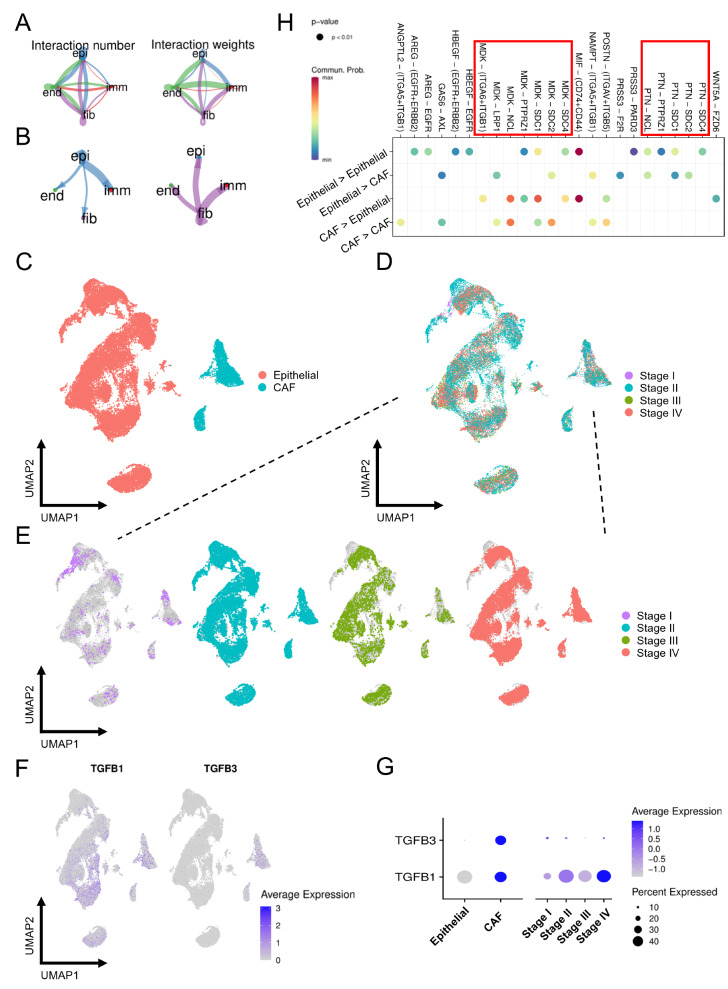
Figure 5 .
Identification of cell-cell interactions in OSCC
(A) Network diagram of the cell-cell interactions of different cells in OSCC. The color scale indicates the number of interactions and interaction weights. (B) The size of the circle represents the number of interactions with all other types of cells, and the thickness of the line represents the interaction number of cells between the lines. (C) UMAP plot of epithelial cells and CAFs colored by cell type. (D) UMAP plot of epithelial cells and CAFs colored by stage. (E) Epithelial cells and CAFs colored by four stages were projected onto the UMAP atlas separately. (F) The expression levels of TGF-β1 and TGF-β3 were projected onto the UMAP atlas. (G) Bubble plot shows the average and percent expression of TGF-β1 and TGF-β3. The size of the dots represents the fraction of cells expressing a particular marker, and the intensity of the color indicates the level of mean expression. (H) Bubble plot of the CAF-epithelial crosstalk pathway. epi: epithelial cell, imm: immune cell, fib: CAF, end: endothelial cell.

