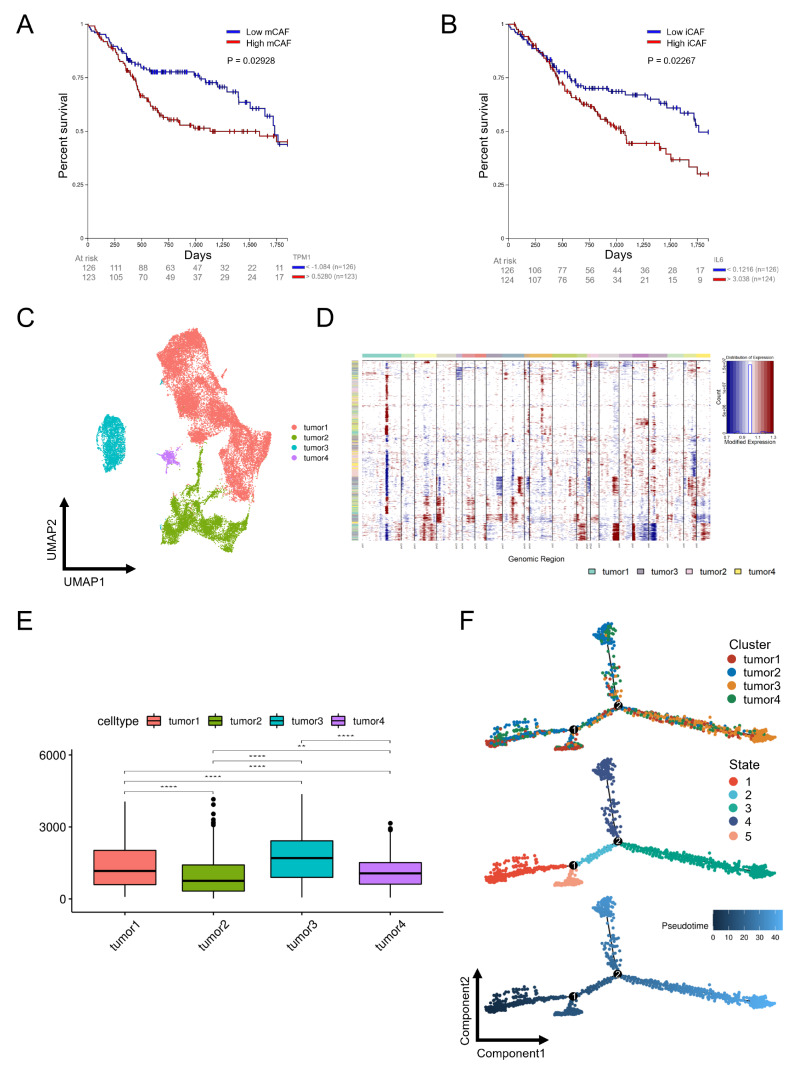
Figure 6 .
The relationship between OSCC malignancy and patient survival
Survival analysis of mCAFs (A) and iCAFs (B) in OSCC. (C) UMAP distribution of four tumor subclusters. (D) Large-scale CNVs of four tumor subclusters were identified. (E) CNV scores of four tumor subclusters. (F) Trajectory order of four tumor subclusters colored by cell type, state and pseudotime.

