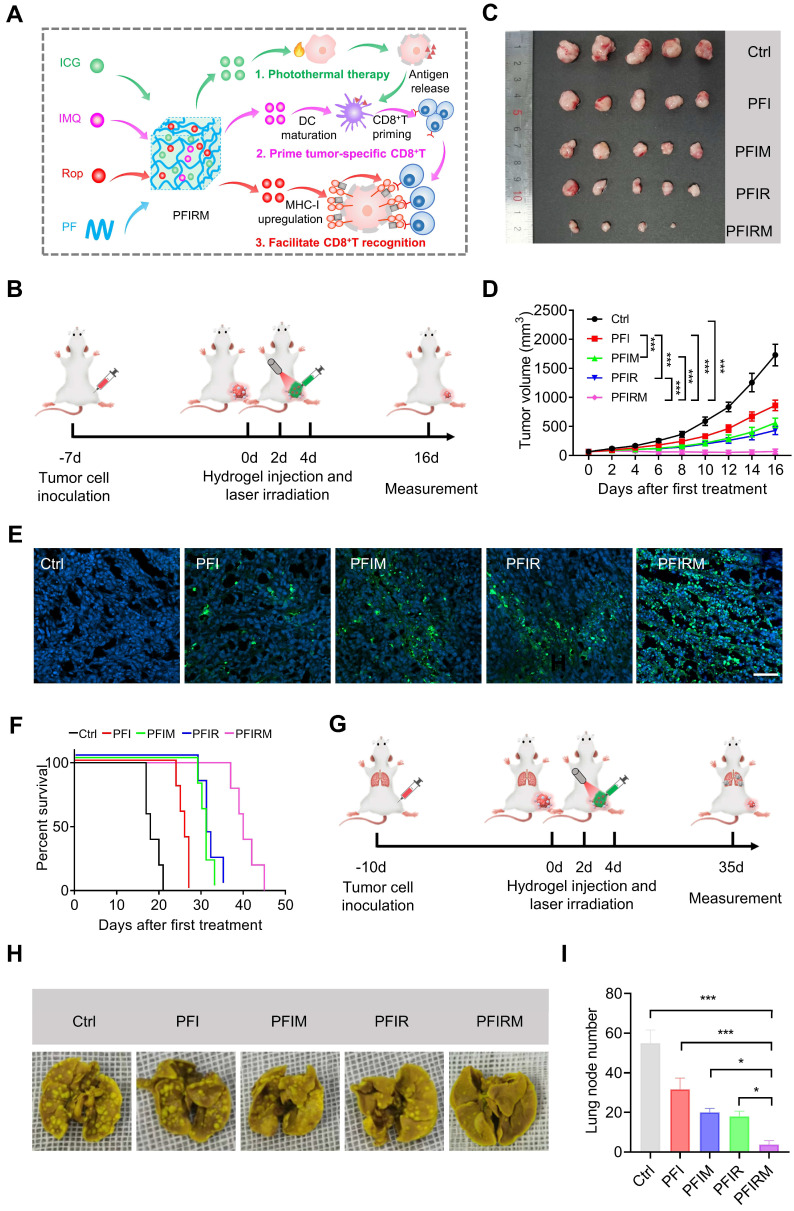
Figure 5.
Antitumor effect of PTT with PFIRM. (A) Schematic design of hydrogel. IMQ: imiquimod, Rop: ropivacaine, PF: PF127. (B) Schematic showing the experimental operation procedure for testing the inhibition of tumor growth. (C) Tumors removed from mice after indicated treatment. (D) Average tumor growth curves (n=5). (E)TUNEL staining of tumor sections. Nuclei were stained with DAPI. Scale bar is 50 μm. (F) Survival curves of tumor-bearing mice after indicated treatment (n=5). (G) Schematic showing the experimental operation procedure for testing the inhibition of tumor metastasis to the lung. (H) Representative images of lung of mice after indicated treatment. (I) Statistical results (n=3) from (H). Data represent mean ± SD. *P < 0.05, **P < 0.01 and ***P < 0.001. 'NS' to indicate non-significance. PFI: ICG-loaded PF127 hydrogel, PFIR: ropivacaine-loaded PFI hydrogel, PFIM: imiquimod-loaded PFI hydrogel, PFIRM: imiquimod and ropivacaine co-loaded PFI hydrogel.

