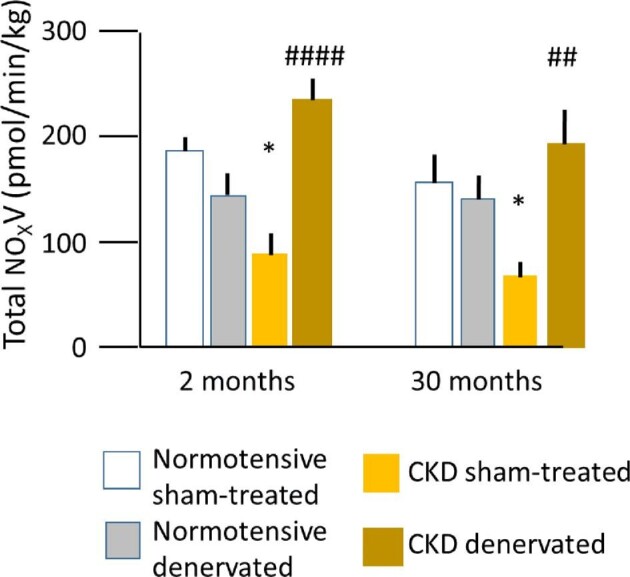
FIGURE 5:

Mean basal total urinary NOx (nitrate + nitrite) excretion (V) in normotensive (control) and hypertensive sheep with CKD 2 and 30 months after renal denervation or sham procedures, respectively. Lines indicate standard error. *P < .05 comparing sham groups at follow-up. ##P < .05, ####P < .0001 comparing sham and treated groups at follow-up. From Singh et al [58].
