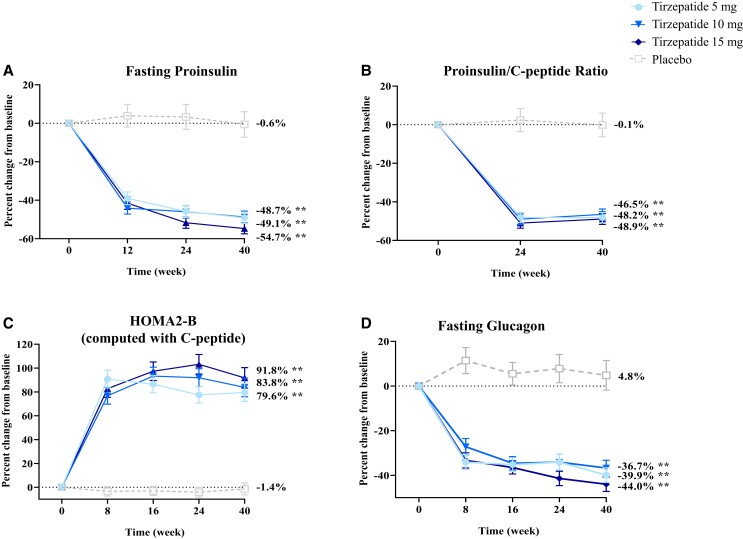
Figure 1.
Percent change from baseline over time in markers of beta-cell function data are estimated percentage means (SE) overtime, mITT (efficacy analysis set) ANOVA analysis (week 0) and MMRM analysis (week 40) using log transformation then convert back to original scale. **P < .001 vs placebo at 40 weeks.
Abbreviations: HOMA2-B, homeostatic model assessment for beta-cell function; mITT, modified intent-to-treat; MMRM, mixed-model repeated measures.

