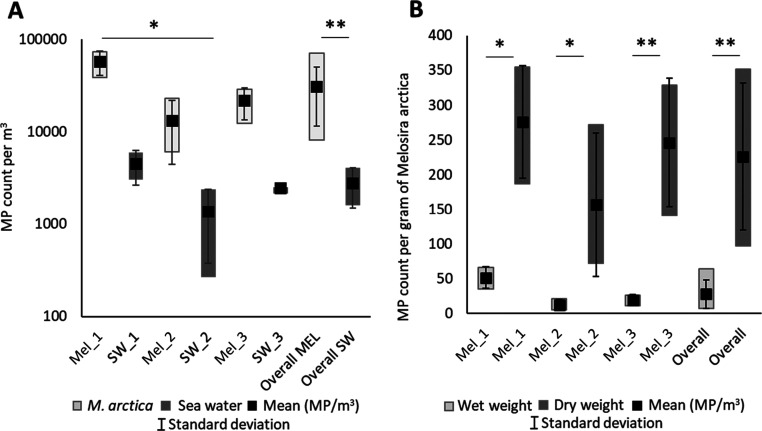
Figure 2.
MP quantities, particle size distribution, and polymer types detected in the samples of the ice alga M. arctica. (A) Boxplot of MP particle counts (10th–90th percentile), means, and standard deviations in M. arctica and surrounding sea water samples (MP m–3). (B) M. arctica MP counts (10th–90th percentile), means, and standard deviations relative to the sample wet and dry weights (g). The asterisks indicate datasets that present a significant difference (* = p < 0.05, ** = p < 0.01).

