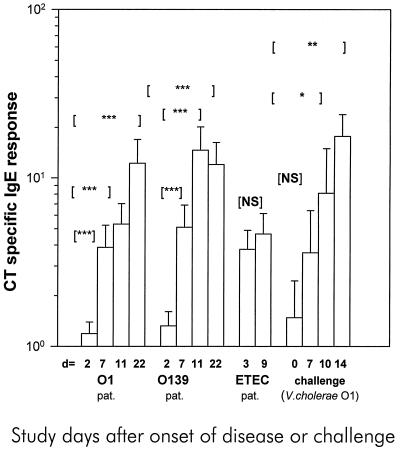
FIG. 1.
The CT-specific IgE antibody response in sera from Bangladeshi patients infected either with V. cholerae serogroup O1 or O139 or with ETEC and North American volunteers challenged with V. cholerae O1. The antibody levels on different days (d) after onset of disease or challenge are shown. GM titers (+1 SEM [error bars]) are given. Asterisks denote statistically significant differences for comparisons between IgE levels at the acute stage and the convalescent stage in cholera and ETEC-infected patients; for challenged volunteers, comparisons between preimmune levels and levels after challenge were carried out. ∗, P was from <0.05 to 0.01; ∗∗, P was from <0.01 to 0.001; ∗∗∗, P was <0.001. NS, not significant; pat., patients.

