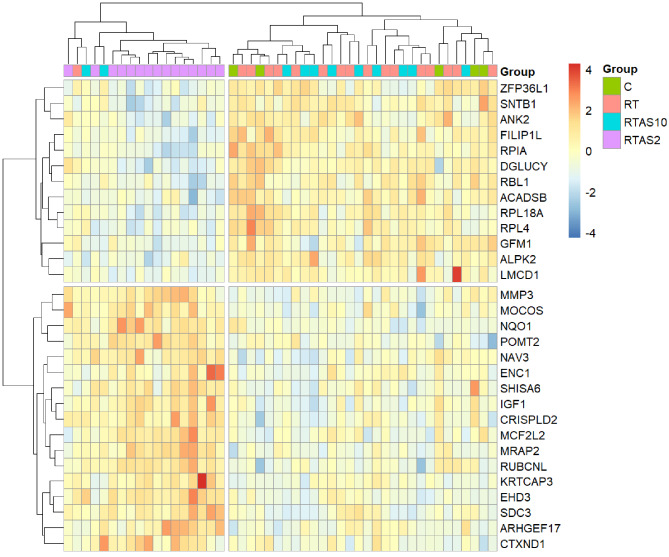
Fig. 3.
A heatmap of the top 30 most differentially expressed genes by FDR, with a minimum 1.2-fold change, from the group comparison RT-AS ≤ 2 vs. RT for all muscle samples subjected to DGE analysis sequenced with standard chemistry reagents at MGI, Latvia. Gene and sample clustering was performed within pheatmap [58]. C: non-resistance trained control group (n = 5); RT: Resistance Trained control group (n = 17); RT-AS ≤ 2: Resistance Trained participant who self-declared AAS exposure ceased ≤ 2 weeks before sampling (n = 15); RT-AS ≥ 10: Resistance Trained participant who self-declared AAS exposure ceased ≥ 10 weeks before sampling (n = 11); DGE: differential gene expression

