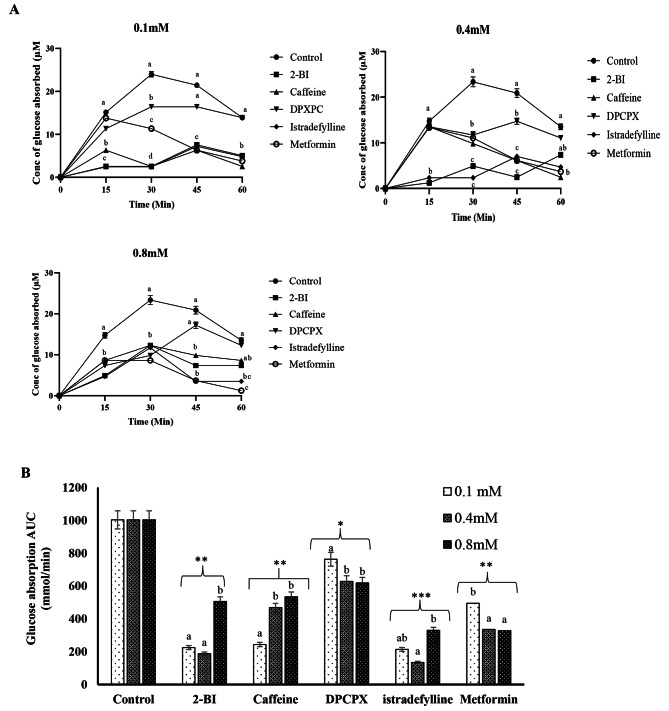
Fig. 2.
(A) Effect of A1 and A2 AR antagonist on glucose absorption across rat jejunum segment isolated in Ussing chamber. AR antagonists were prepared in Kreb buffer containing 11.1mM of glucose was added on the mucosal side. (B) AUC data for 0–60 min post glucose absorption are shown. Baseline subtraction for control was used to calculate AUC values for all groups, to ensure full treatment benefits are recognised. Values represent mean ± SD for triplicate. a−c Different alphabets near the lines (2 A) or bar (2B) for a given time or group respectively represent the significance of difference (p < 0.05). *P < 0.05, **P < 0.01 and ***P < 0.001 compared to control

