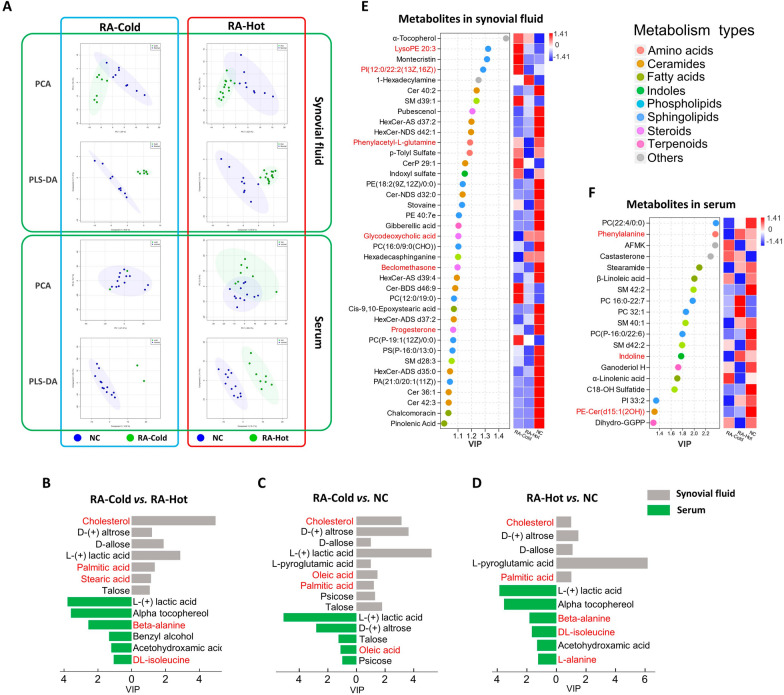
Fig. 3.
Metabolic profilings of serum and synovial fluid samples obtained from RA-Cold and RA-Hot patients. A PCA and PLS-DA score plots of metabolic profiling data for RA-Cold and RA-Hot groups. B–D Potential metabolic markers detected by GC–MS, sorted according to VIP values, are marked in bright blue as differential metabolites in synovial fluid, and dark blue as differential metabolites in serum. Dotrod-heatmap of potential metabolic markers in synovial fluid (E) and serum (F) detected by LC–MS. On the left is a scatter plot, which represents the VIP values and categories of metabolites, with different colors representing different metabolite categories. The right heat map represents the expression of metabolites in different groups. The red and blue markers represent the content. The redder (blue) the color is, the higher the content (lower). Both final differential metabolites were selected by VIPplsda > 1, fold change > 2 or < 0.5, P-value < 0.05

