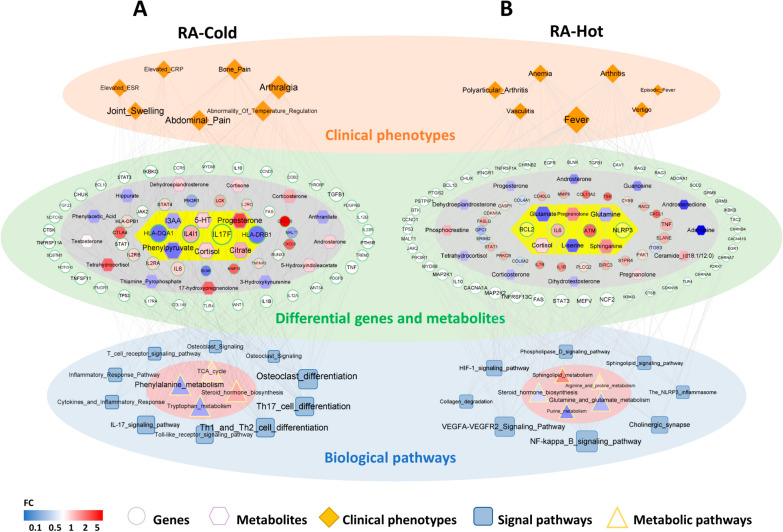
Fig. 5.
Integrative network fusion-based multi-omics data analysis for identification candidate biomarkers of RA-Cold and RA-Hot. Multi-level “Disease-Syndrome-Gene-Metabolite-Pathway” network diagram for RA-Cold biomarkers (A) and RA-Hot biomarkers (B). The orange diamond nodes refer to the representative clinical symptoms of RA-Cold and RA-Hot patients. The circle nodes refer to the key network target genes of RA-Cold and RA-Hot groups, in which red and blue nodes refer to the up-regulated and down-regulated genes according to the clinical transcriptomic profiling, and white nodes refer to the symptom-related genes (no differential changes detected in the clinical transcriptomic profiling), and the yellow part in the center represents the candidate biomarkers. Hexagons nodes refer to the differential metabolites, among which red and blue hexagon nodes respectively refer to up-regulated and down-regulated metabolites. The square and triangle nodes refer to the signal pathways enriched by the key network target genes and differential metabolites, respectively

