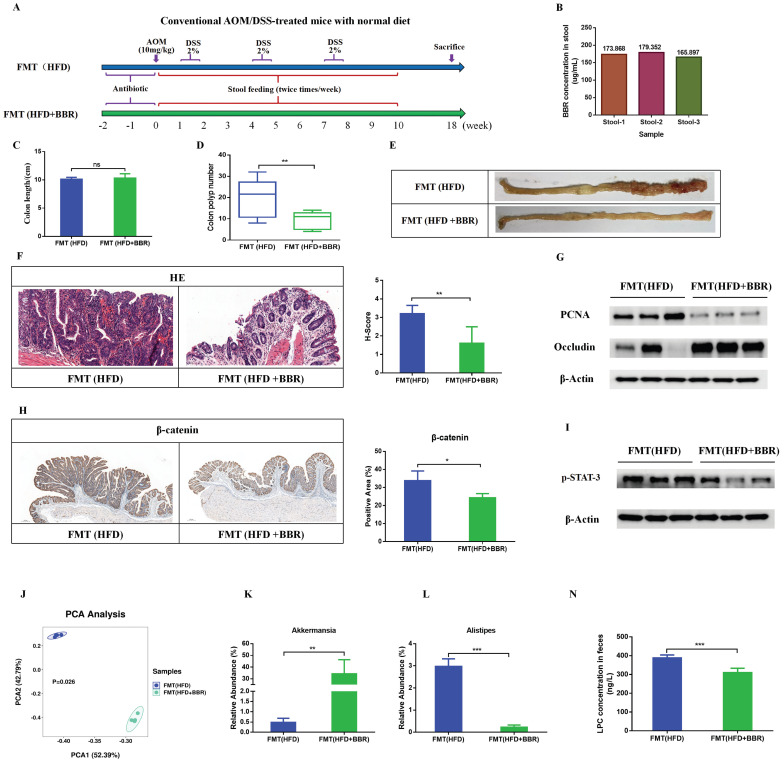
Figure 8.
FMT recapitulates the inhibitory effects of BBR on colorectal tumourigenesis in mice fed with HFD. (A) Design of FMT experiment on AOM/DSS mice. (B) BBR concentration in the stool in two groups of mice. (C) Colon length. (D) Number of colon polyps. (E) Representative images of the colon at sacrifice. (F) HE staining of intestinal sections and histology scores: bar=50μm, (10μm × 5). (G) Expression of PCNA and occludin in colon tissues. (H) IHC staining of colorectal sections, showing the expression of β-catenin: bar=200μm, (40μm × 5). (I) Expression of p-STAT3 in colon tissues. (J) Principal component ordination analysis of the gut microbiota between the two groups. (K) Relative abundance of Akkermansia in stool samples of FMT(HFD) mice and FMT(HFD+BBR) mice. (L) Relative abundance of Alistipes in stool samples of FMT(HFD) mice and FMT(HFD+BBR) mice. (N) Mouse stool LPC concentrations in the two groups. (*p < 0.05, **p < 0.001, ***p < 0.001).

