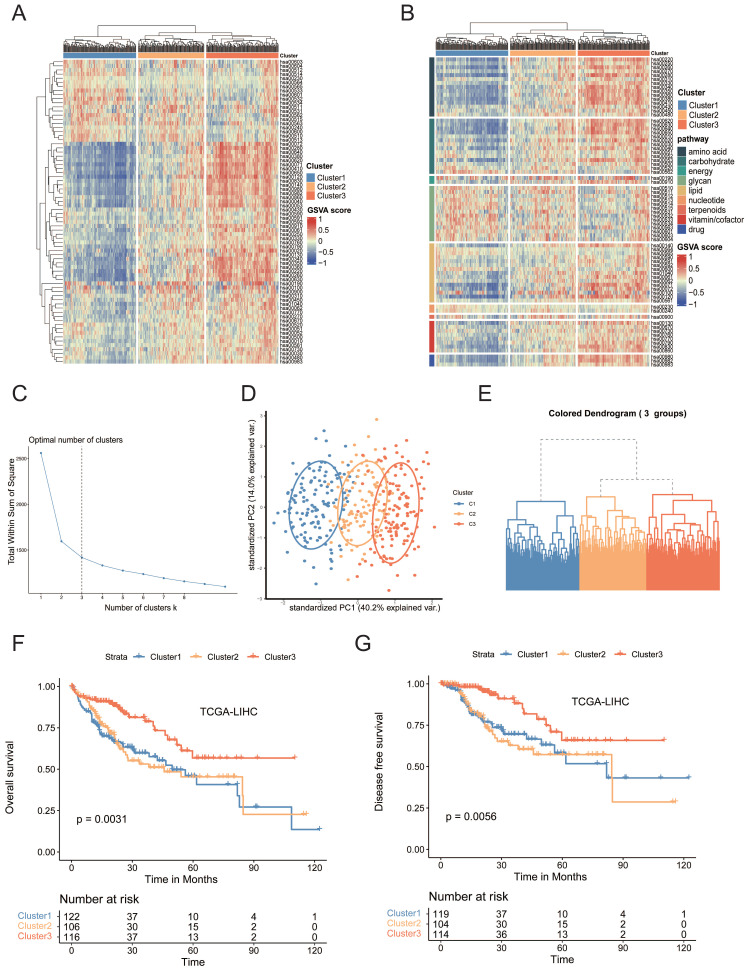
Figure 1.
(A) Heatmap of metabolic-pathway-based GSVA analysis in TCGA-LIHC samples. (B) Heatmap of metabolic-pathway-based GSVA analysis according to the metabolic classes in TCGA-LIHC samples. (C) Determination of the optimal number of clusters (k). The elbow method shows k =3 as the optimal number of clusters. (D) The PCA plot of the samples from three different subtypes. The blue spots indicated the samples from cluster 1. The yellow spots indicated the samples from cluster 2, and the red spots indicated the samples from cluster 3. (E) Hierarchical clustering highlighting three different clusters. Euclidian distances and Ward's linkage were used. (F) Kaplan-Meier curves of OS among clusters in the TCGA-LIHC cohort. (G) Kaplan-Meier curves of DFS among clusters in the TCGA-LIHC cohort.

