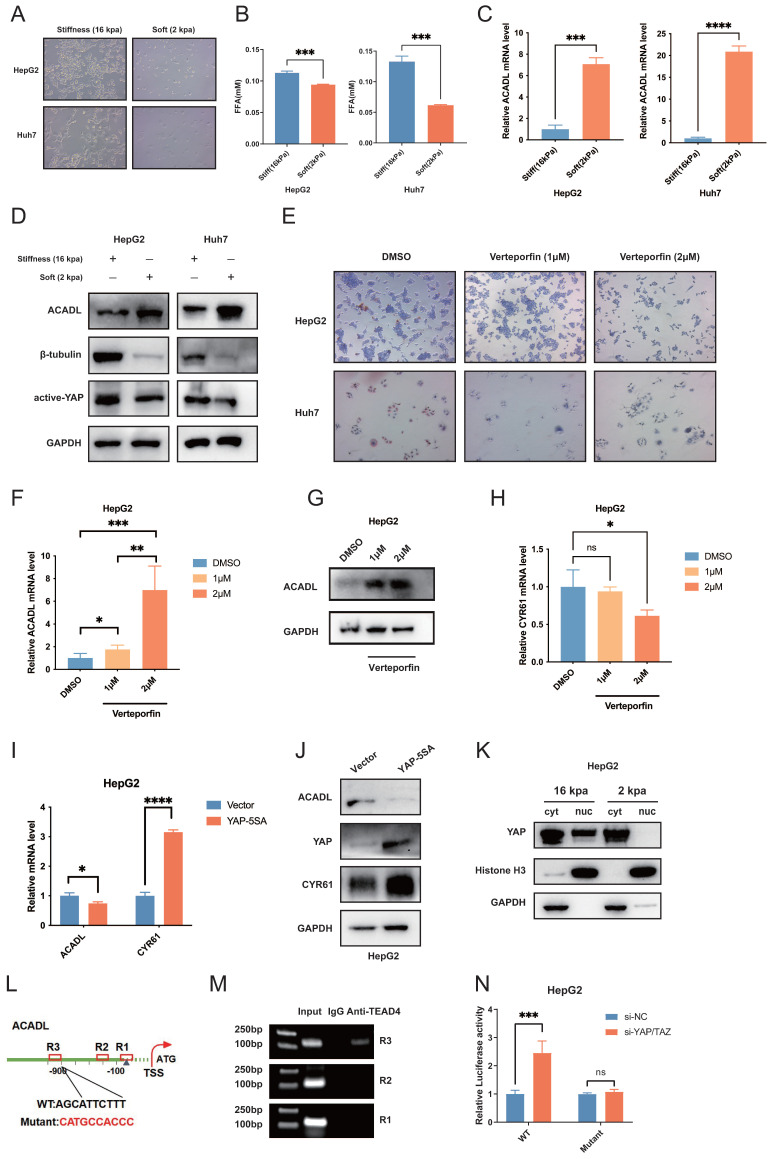
Figure 6.
(A) HCC cells morphology was observed by light microscopy under different stiffnesses (2kpa &16kpa). (B) The level of free fatty acid release into cell culture medium under different stiffnesses (2kpa &16kpa) after 48 hours of culture. (C) qRT-PCR analysis of ACADL mRNA expression in HCC cells under different stiffnesses (2kpa &16kpa) after 48 hours of culture. (D) The expression level of ACADL, β-tubulin, and active yap were compared by western blotting, and GAPDH was used as a loading control. (E) Bright-field images of HCC cells after treated with DMSO or verteporfin of indicated concentration. (F) The mRNA expression level of ACADL of HepG2 cells after treated with DMSO or verteporfin of indicated concentration. (G) The protein level of ACADL of HepG2 cells after treated with DMSO or verteporfin of indicated concentration. (H) The mRNA level of CYR61 of HepG2 cells after treated with DMSO or verteporfin of indicated concentration. (I) The mRNA expression level of ACADL and CYR61 in YAP5SA overexpression HepG2 cells. (J) The western showing the expression levels of ACADL and CYR61 in YAP5SA overexpression HepG2 cells. (K) Cytosolic and nuclear proteins from HepG2 cells under different stiffnesses (2kpa &16kpa) were separated to detect expression of YAP by western blotting. Histone H3 and GAPDH were used as a loading control. (L) Schematic illustration of ACADL promoter region with potential TEAD4 binding sites (TBS). The WT and TBS mutant sequences were indicated. R1, R2, and R3 indicated Region1, Region2, and Region3 in ACADL promoter containing the potential TBS respectively. (M) A Chromatin immunoprecipitation (CHIP) analysis. HepG2 were used to extract cross-linked DNA, and CHIP was performed using anti-P300 and anti-RNAPol II. PCR was carried out using a primer designed according to the ACADL promoter. IgG CHIP was used as a negative control. (N) Luciferase analysis showing the effects of siRNA-YAP/TAZ on ACADL promoter R3 containing the WT or mutant TBS region in HepG2 cells.

