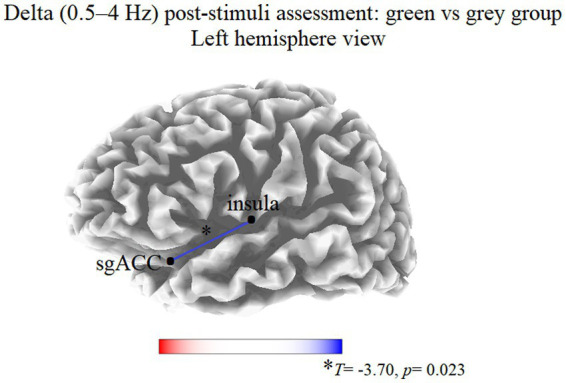
Figure 1.

Results of the eLORETA functional connectivity between group comparison (green vs. gray) in the delta frequency band at T1. Blue lines indicate connections presenting a decrease of EEG functional connectivity. Red lines (not present) would indicate an increase of EEG functional connectivity. Threshold values (T) for statistical significance are reported at the bottom of the figure. sgACC, subgenual anterior cingulate cortex.
