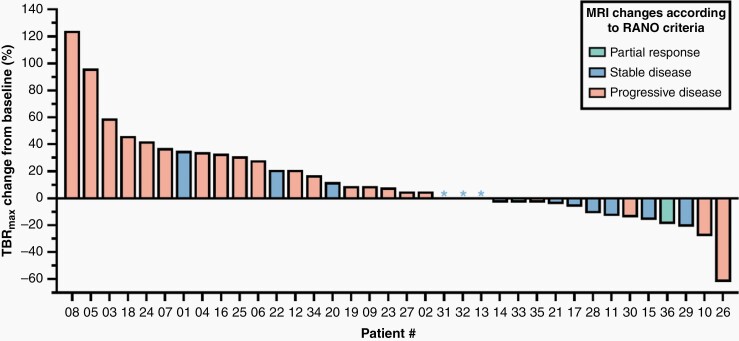
Figure 1.
Waterfall plot of responses based on changes of the static FET uptake parameter maximum tumor-to-brain ratio (TBRmax) in relation to MRI responses according to RANO criteria. Relative changes of TBRmax after two cycles of lomustine-based chemotherapy are plotted on the y-axis. In relation to the individual metabolic response on FET PET, patient columns on the x-axis are color-coded assigned to the respective MRI changes according to RANO criteria (ie, green = Partial Response; blue = Stable Disease; orange = Progressive Disease). Basically, the most patients with Progressive disease on MRI showed an increase in TBRmax, and those with Partial response had a decrease in TBRmax. Notably, considerable discrepancies, that is, increasing metabolic activity on FET PET and unchanged MRI (eg, patients #1, #22), and decreasing metabolic activity and stable (eg, patients #17, #28, #29) or progressive MRI changes (patients #26 and #35) could be observed.

