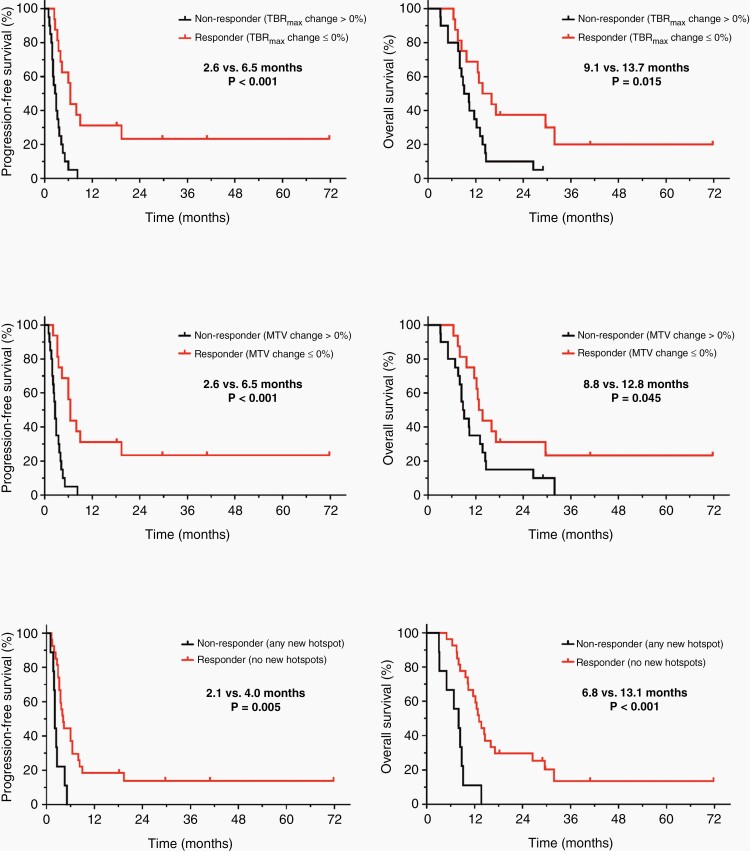
Figure 2.
Kaplan–Meier curves for PFS and OS separated by relative changes of the maximum tumor-to-brain ratio (TBRmax) (top row), metabolic tumor volume (MTV) (middle row), and the of occurrence of new hotspots (bottom row) on FET PET after two cycles of lomustine-based chemotherapy. Responders on FET PET defined by any decrease or an unchanged TBRmax and/or MTV at follow-up compared to baseline had a significantly longer PFS (both 6.5 vs. 2.6 months; P < .001) and OS (TBRmax, 13.7 vs. 9.1 months; P = .015; MTV, 12.8 vs. 8.8 months; P = .045) than non-responders (ie, patients with an increase of TBRmax and/or MTV at follow-up compared to baseline). Non-responders on FET PET defined by the occurrence of any new distant hotspot at follow-up compared to baseline had a significantly shorter PFS (2.1 vs. 4.0 months, P = .005) and OS (6.8 vs. 13.1 months, P < .001) than patients without any new distant hotspots at follow-up.

