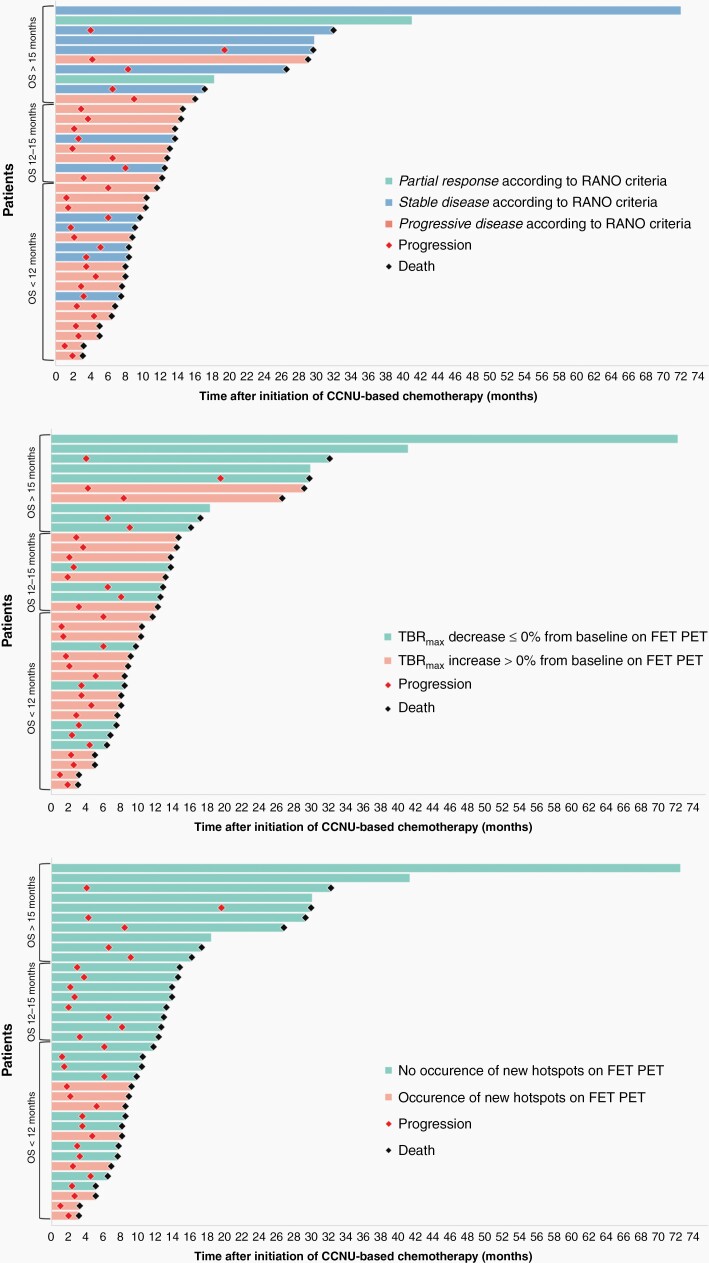
Figure 3.
Swimmer plots of each individual patient after initiation of lomustine-based chemotherapy. Patient bars are sorted by the OS and are color-coded based on changes in RANO criteria (top row), maximum tumor-to-brain ratio (TBRmax) (middle row), and the occurrence of new hot spots on FET PET (bottom row). Of note, the occurrence of new hotspots are present only in patients with an OS < 12 months, indicating its high positive predictive value for OS.

