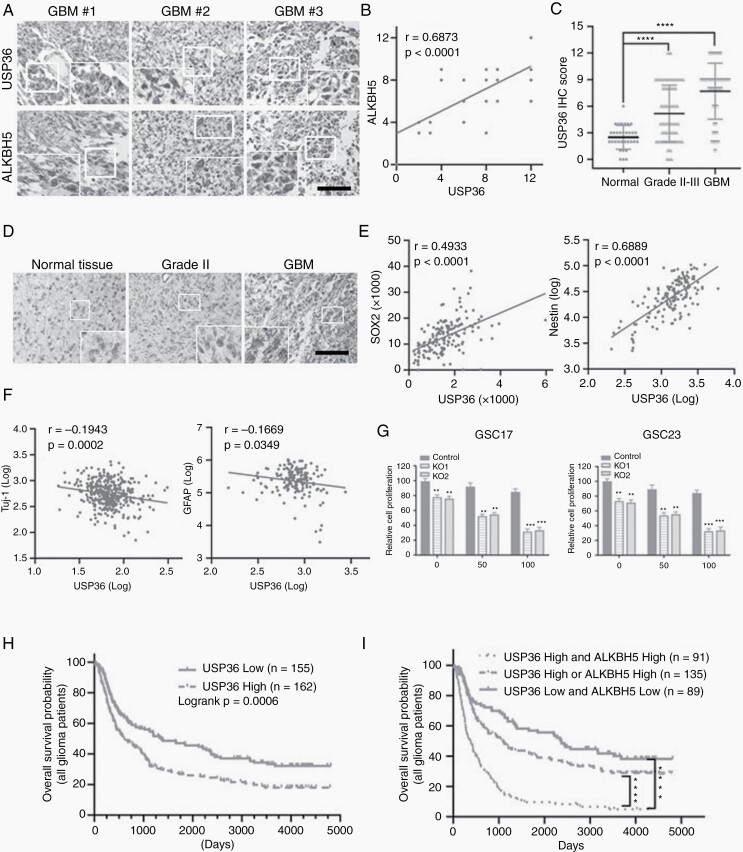
Figure 6.
USP36 is increased in glioma specimens and correlates with ALKBH5 protein level, and USP36 knockout sensitized GSCs to TMZ treatment. (A) Immunohistochemical staining detected the expression of USP36 and ALKBH5 in 43 glioblastoma specimens. Scale bar, 200 μm. (B) Correlation between ALKBH5 and USP36 protein expressions in human specimens was analyzed by the Pearson correlation test. IHC staining of USP36 and ALKBH5 was scored as 1–12 according to the percentage of positive cells and staining intensity in a sample. Note that the scores of some samples overlap. (C) The expression levels of active USP36 in 34 normal, 87 grade II and III astrocytomas were compared with those in 50 glioblastoma specimens. The significance was determined by statistical analysis t-test. ****P < .0001. (D) IHC staining of USP36 was carried out on normal, grade II astrocytoma and glioblastoma specimens. Scale bars, 200 μm. (E/F) Correlation between USP36 and indicated gene expressions in the TCGA dataset was analyzed by Pearson correlation test. (G) The USP36 knockout or control GSC17 and GSC23 cells were treated with vehicle (0.05% DMSO) or TMZ (50 or 100 μM in the vehicle) for 3 days. The cell proliferation was assessed by the CCK8 assay. Student’s t-test, **P < .01, ***P < .001. (H) Kaplan–Meier survival curves were used to assess the overall survival of primary and recurrent glioma patients (all patients) in the CGGA database. The median was the cutoff value used to classify USP36 mRNA expression as high or low. Log-rank test, P = .0006. (I) Kaplan–Meier survival curves were used to assess the overall survival of primary glioma patients and recurrent in the CGGA database based on the expression levels of USP36 and/or ALKBH5 expressions. Log-rank test, ****P < .0001.

