Fig. 1.
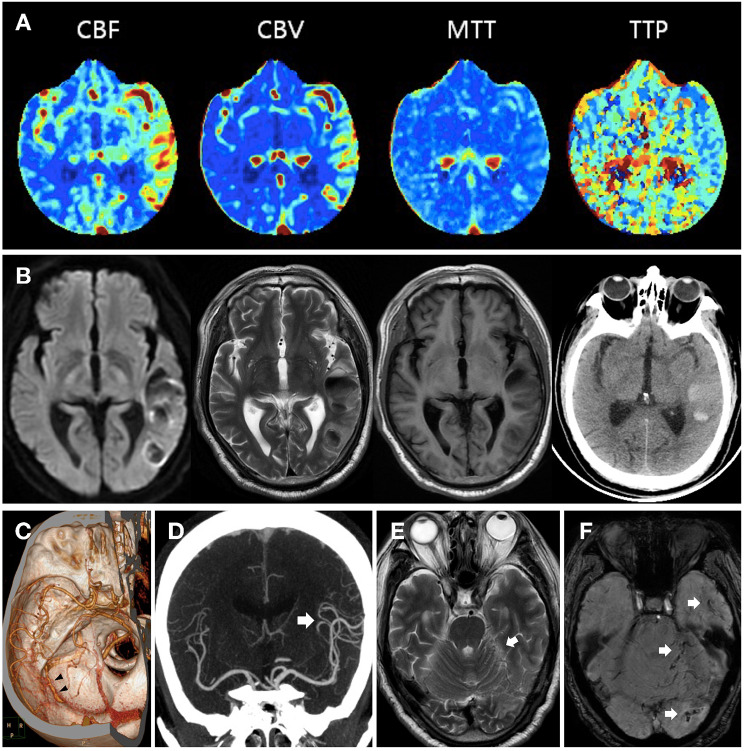
Cranial imaging appearance of the patients. (A) CT perfusion showed regional hyperperfusion in the left temporal lobe, with characteristics of a significant increase in cerebral blood flow (CBF), a mild increase in cerebral blood volume (CBV), and a prolonged mean transit time (MTT) and time to peak (TTP). (B) Cranial MRI and CT indicated hemorrhagic transformation in the left temporal lobe after intravenous thrombolysis. (C) Cranial CTA showed an early visualized left transverse sinus segment (black arrowhead), which was previously ignored and misinterpreted as venous contamination. (D) Hypervascularity in the left cerebral hemisphere (white arrow) was noted in cranial CTA, consistent with the regional hyperperfusion pattern. (E) Cranial MRI T2 sequence revealed tortuous abnormal vascular flow voids (white arrow) in the left temporo-occipital lobe and cerebellum. (F) Cranial susceptibility-weighted imaging showed clusters of engorgement veins, thought to represent collateral venous flow (white arrow)

