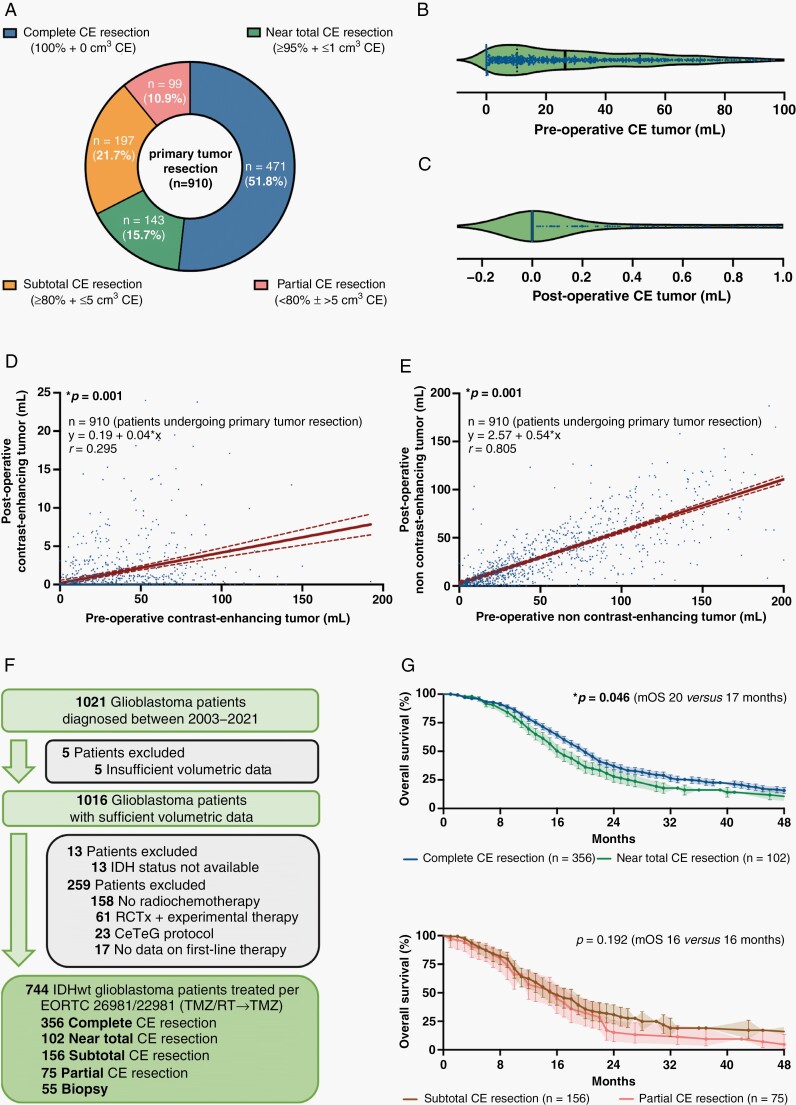
Fig. 2.
Stratification according to extent of CE tumor resection and prognostic implications. (A) Stratification of all patients undergoing microsurgical tumor resection (n = 910) according to the previously proposed classification system based on extent of CE tumor resection. (B and C) Pre-(B) and postoperative CE tumor volume (C; in cm3) after microsurgical tumor resection (n = 910). Median ± 95% CI. (D and E) Simple linear regression analyses comparing the pre- to the postoperative tumor volumes for CE (D) and non-CE tumor (E) in patients undergoing microsurgical tumor resection (n = 910). Pearson correlation coefficients (r), calculated equations including slope β 1, and P-values are given. Dotted lines: 95% CI. (F) Schematic representation of the formation of a patient cohort exclusively including IDH-wildtype glioblastomas homogenously treated per EORTC-26981/22981-protocol (n = 744). (G and H) Kaplan–Meier estimates of OS in IDH-wildtype glioblastomas treated per EORTC-26981/22981-protocol (n = 744). Patients stratified to the category “complete CE resection” were compared to “near total CE resection” (G), and patients stratified to the category “subtotal CE resection” were compared to “partial CE resection” (H). Points: deceased/censored patients; shading: SEM.

