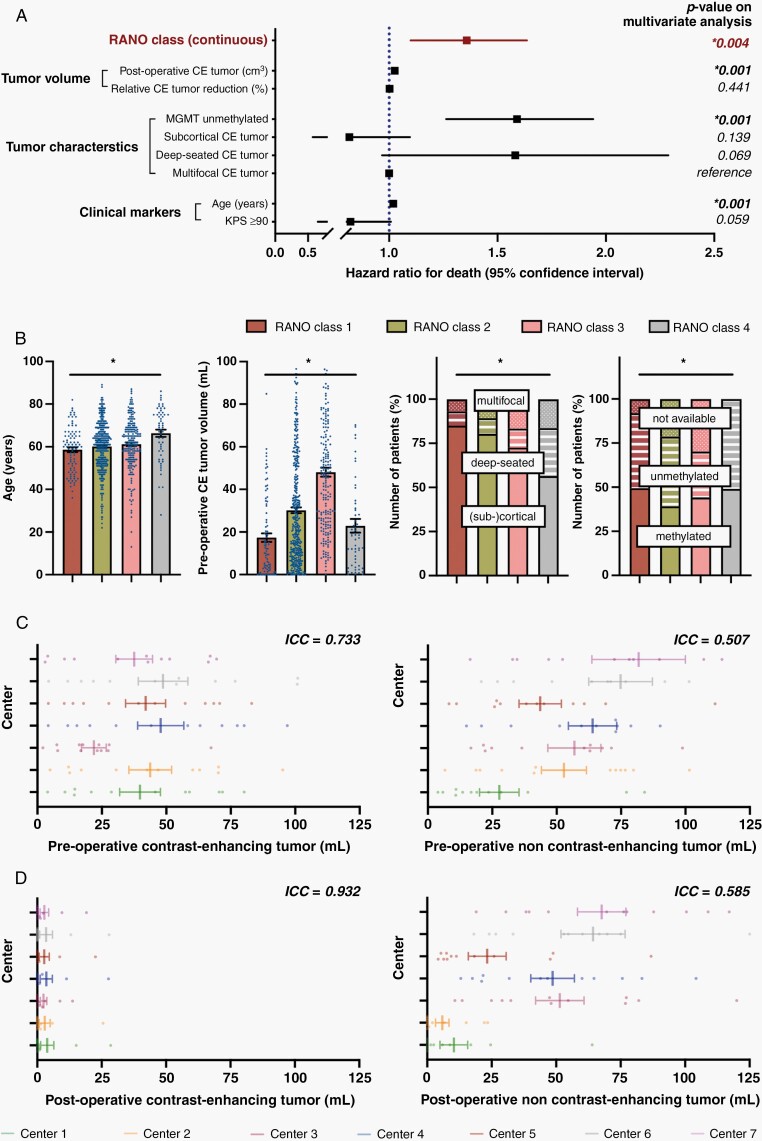
Fig. 5.
Multivariate analysis and determination of inter-rater variability to control for potential confounding effects. (A) Multivariate analysis using a Cox proportional hazard regression model estimating the hazard ratio for death of numerous factors which were of significance on univariate analysis. Note that the prognostic value of the RANO classes and absolute residual CE tumor volume (in cm3) was conserved, whereas the prognostic relevance of the relative reduction of CE tumor volume (in percentage) was lost. “Multifocal CE tumor” served as reference for “deep-seated CE tumor” and “subcortical CE tumor.” Hazard ratio ± 95% CI. (B) Distribution of age (left panel), preoperative CE tumor volume (second to left panel), tumor localization (second to right panel), and MGMT promotor status (right panel) across the 4 different RANO categories. Asterisks indicate P ≤ .05 when all four groups were tested together using a Kruskal–Wallis test (for continuous data) or a χ2-test (for categorical variables). Mean ± SEM for continuous data. (C and D): Volumetric analyses of twelve identical pre-(C) and postoperative (D) MRIs by the seven participating centers (color-coded). ICCs (<0.5: poor reliability, 0.5–0.75: moderate reliability, 0.75–0–9: good reliability, >0.9: excellent reliability) are reported for pre-and postoperative CE (left panel) as well as non-CE tumor (right panel). Note that ICCs are higher for post- than for preoperative imaging and for CE than for non-CE tumor. Mean ± SEM.

