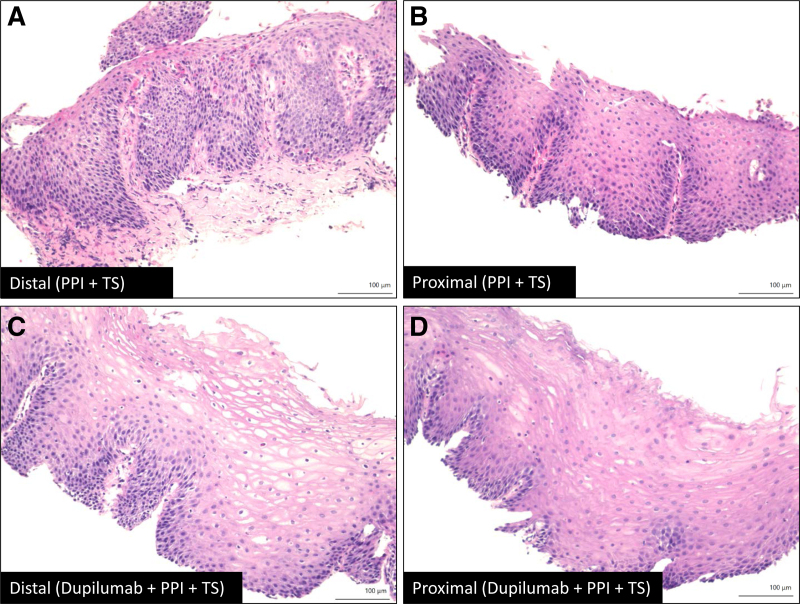
FIGURE 2.
Representative images of the esophageal biopsies (H&E stain): (A) and (B) Distal and proximal sites, respectively, on PPI and TS showing basal cell hyperplasia and intense eosinophilia; (C) and (D) Distal and proximal, respectively, on dupilumab, PPI and TS illustrating significant improvement in basal cell hyperplasia and eosinophilia. PPI = proton pump inhibitors; TS = topical corticosteroids.

