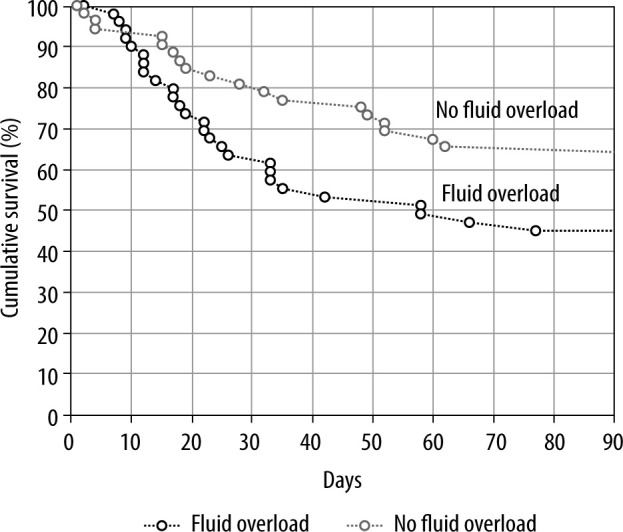
FIGURE 5.

Kaplan-Meier survival curve of ICU-patients, dichotomised by the presence or absence of 5% fluid overload (FO) according to bio-electrical impedance analysisanalysed volume excess. The overall ICU mortality was 39.6% (n = 40) and the hospital mortality was 47.5% (n = 48) for patients in this study. The log rank test showed that the survival curves for patients in the FO– group were not significantly lower than those for the FO+ group
