
Table 3.
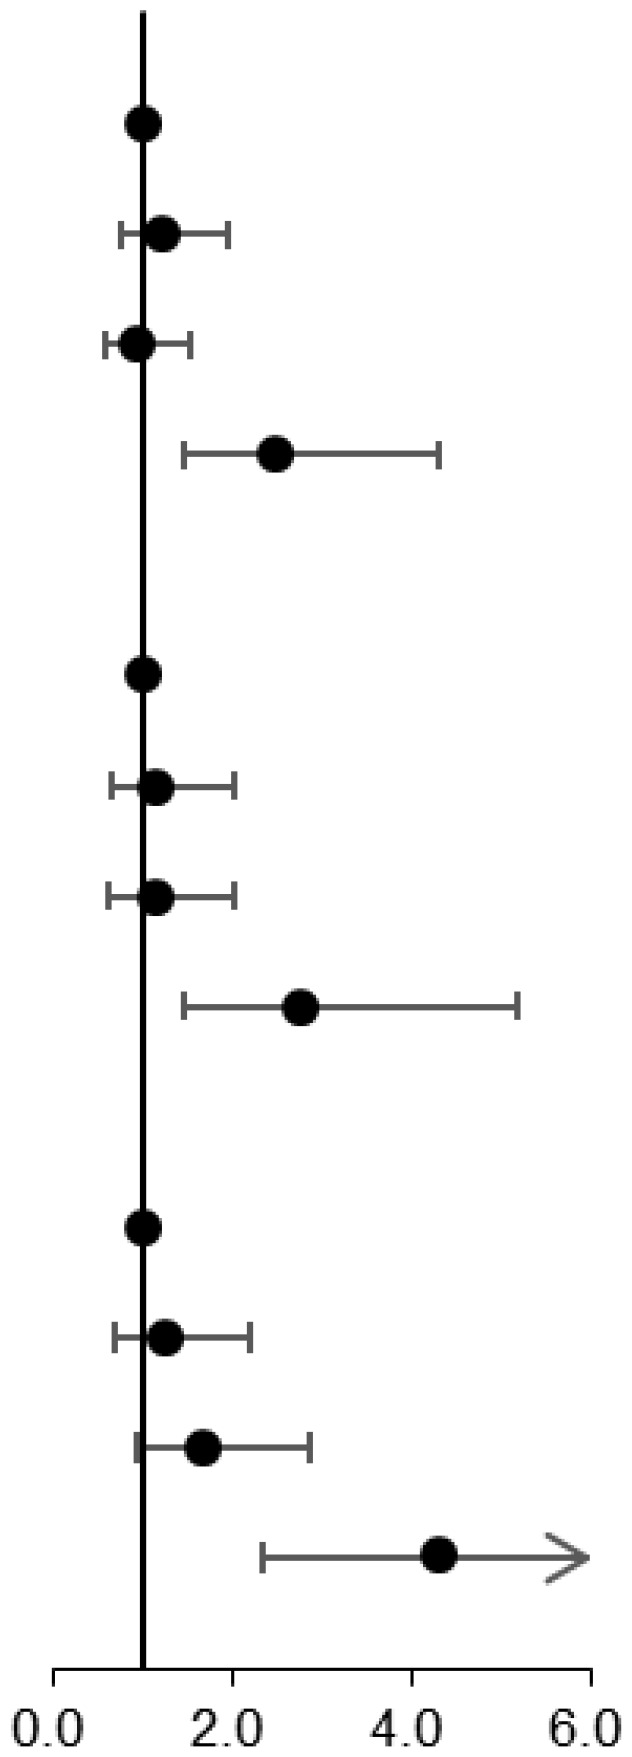
Association of NAD+ levels with metabolic disease components in the multivariable analysis among the whole population.
| Metabolic disease components | Events, N (%) | Odds ratios (95% CI) | ||
|---|---|---|---|---|
| Unadjusted | Adjusted | |||
| 1 component vs 0 component |
|
|||
| Quartile 1 | 87 (25.0) | Ref | Ref | |
| Quartile 2 | 97 (27.5) | 1.40 (0.95-2.07) | 1.19 (0.75-1.88) | |
| Quartile 3 | 71 (20.5) | 1.22 (0.80-1.84) | 0.95 (0.58-1.55) | |
| Quartile 4 | 79 (22.8) | 2.77 (1.74-4.40) | 2.49 (1.45-4.28) | |
| 2 components vs 0 component | ||||
| Quartile 1 | 58 (16.7) | Ref | Ref | |
| Quartile 2 | 71 (20.1) | 1.54 (0.99-2.37) | 1.18 (0.68-2.07) | |
| Quartile 3 | 67 (19.4) | 1.72 (1.10-2.68) | 1.16 (0.65-2.07) | |
| Quartile 4 | 68 (19.6) | 3.57 (2.18-5.86) | 2.78 (1.48-5.24) | |
| 3-6 components vs 0 component | ||||
| Quartile 1 | 75 (21.6) | Ref | Ref | |
| Quartile 2 | 83 (23.5) | 1.39 (0.93-2.09) | 1.27 (0.72-2.23) | |
| Quartile 3 | 122 (35.3) | 2.42 (1.63-3.60) | 1.67 (0.96-2.91) | |
| Quartile 4 | 158 (45.5) | 6.42 (4.12-10.01) | 4.44 (2.40-8.21) | |
Multivariable analysis adjusted for age, gender, the number of RBCs, smoke, drink, exercise, education, and meat. CI, confidence interval, Ref, reference.