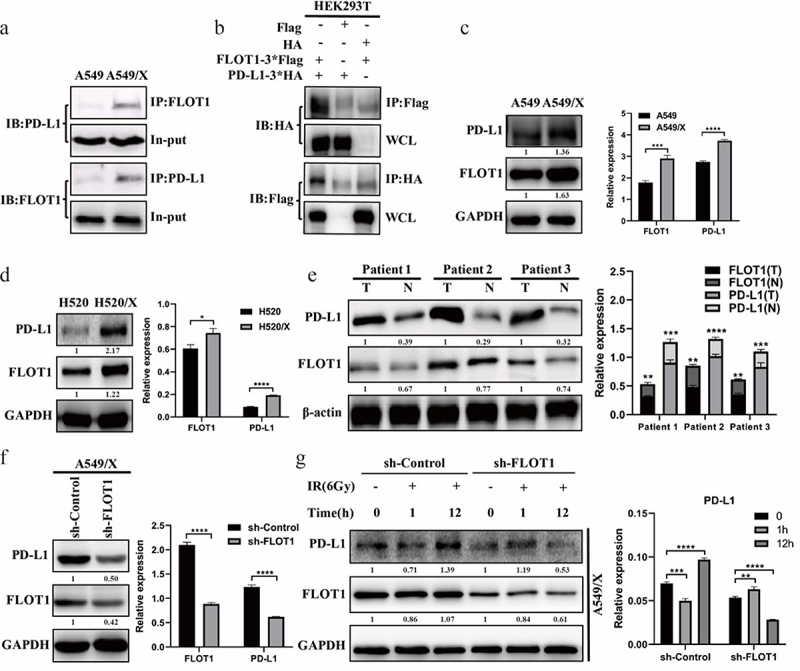
Figure 1.

The expression of PD-L1 was reduced following FLOT1 depletion. (a) Endogenous Co-IP reactions of FLOT1 with PD-L1 in A549 and A549/X cells. (b) Immunoblot results of the whole cell lysates (WCL) and anti-Flag/anti-HA immunoprecipitates from HEK293T cells transfected with Flag-FLOT1 plus HA-PD-L1, Flag-FLOT1 plus HA-vector, and HA-PD-L1 plus Flag-vector, respectively. (c and d) Western blotting analysis of FLOT1 and PD-L1 expression in parental cells and radioresistant cells (A549 vs. A549/X; H520 vs. H520/X). (e) Western blotting analysis of FLOT1 and PD-L1 expression in three paired primary NSCLC tissues (T) and matched adjacent nontumor tissues (N) from the same patient. (f) Western blotting analysis of FLOT1 and PD-L1 expression in A549/X cells transduced with shRNA targeting FLOT1 or control shRNA. (g) Western blotting analysis of FLOT1 and PD-L1 expression after ionizing radiation (6 Gy) in A549/X cells transduced with shRNA targeting FLOT1 or control shRNA. Each experiment was performed in triplicate. Relative expression was represented by the ratio of the gray values for the target protein and internal reference. The protein fold change was calculated and annotated under the target bands. The fold-change thresholds had to be greater than 1.2 or lower than 0.8 with a P-value<0.05. The values were presented as the mean ± SD. *p < 0.05; **p < 0.01; ***p < 0.001; ****p < 0.0001.
