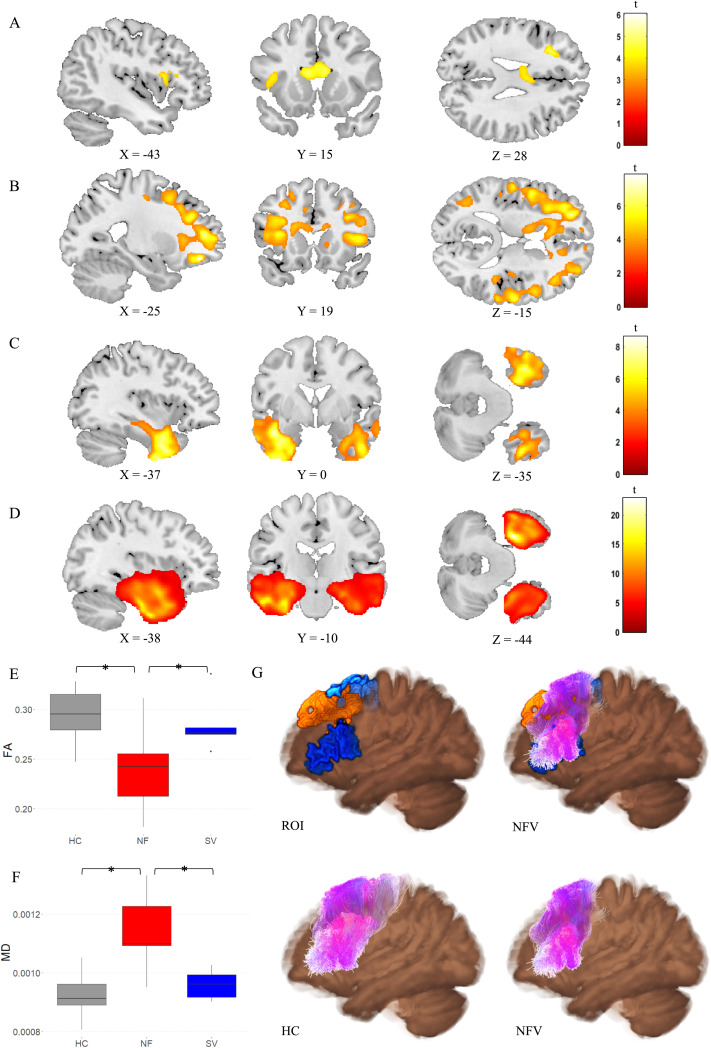
Figure 6. .
Diffusion tensor imaging (DTI) metrics. (A) Fractional anisotropy (FA) and (B) Mean diffusivity (MD) in NFV patients versus controls (cluster-level FWE-corrected p < 0.05). (C) FA and (D) MD in SV patients versus controls (cluster-level FWE-corrected p < 0.05). Comparison of (E) FA and (F) MD in the left frontal Aslant tract between the NFV and SV subtypes and healthy controls (HC). (G) 3D visualization of the left Aslant tract projected on the average FA map—Top left: seed regions (blue) and result of deformation-based morphometry (DBM) (orange); Top right: seed regions (blue) and result of DBM (orange) combined with Aslant tract streamlines of NFV patients (purple); Bottom left: streamlines of controls (purple); Bottom right: streamlines of NFV patients (purple). ROI: region of interest. HC: healthy controls. NFV: participants with non-fluent variant of primary progressive aphasia. SV: participants with semantic variant of primary progressive aphasia.

