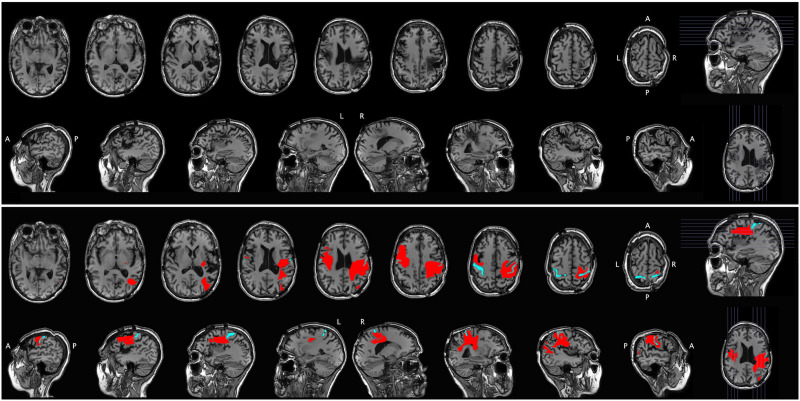
Figure 2. .
Structural MRI for Case 2. The raw scan is shown in the top portion of the figure, with axial slices (first row) and sagittal slices (second row). The same scan is shown in the bottom portion of the figure, with the lesion segmentation highlighted in red and the central sulcus highlighted in cyan for reference. A = anterior, P = posterior, L = left, R = right.

