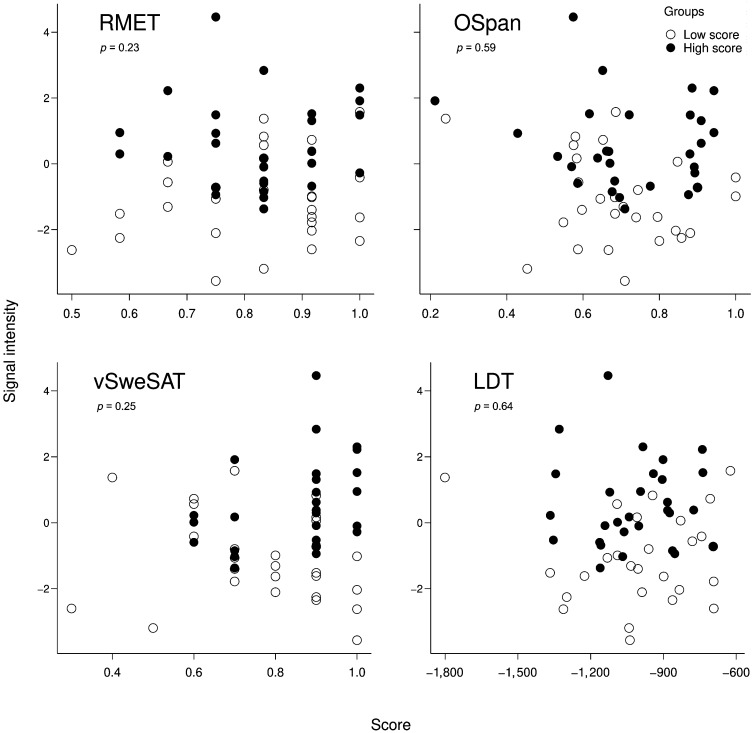
Figure 4. .
Precuneus cluster. Single subject signal average (across voxels in the cluster) of indirect vs. direct first level contrast values for the precuneus cluster vs. scores for four behavioral tests: RMET, OSpan, vSweSAT, and LDT. Data for participants from the high (low) group are shown as filled (not filled) dots. The p values indicate the outcome of two-tailed Pearson correlation tests with RIN-transformed data.

