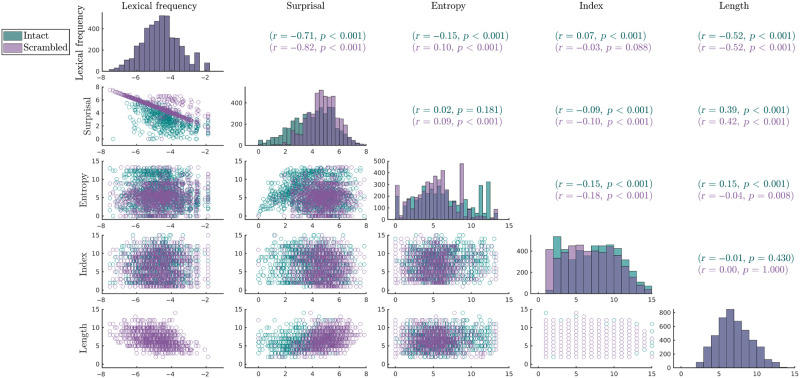
Figure 1. .
Correlation matrix for predictor variables lexical frequency (log10-transformed), surprisal (log10-transformed), entropy, index, and word length (respectively) for the content words. Scatterplots between corresponding pairs of predictors are presented in the lower off-diagonal. Pearson’s correlation coefficients and corresponding p values are presented on the upper off-diagonal. Histograms present the distribution of each predictor variable on the diagonal.

