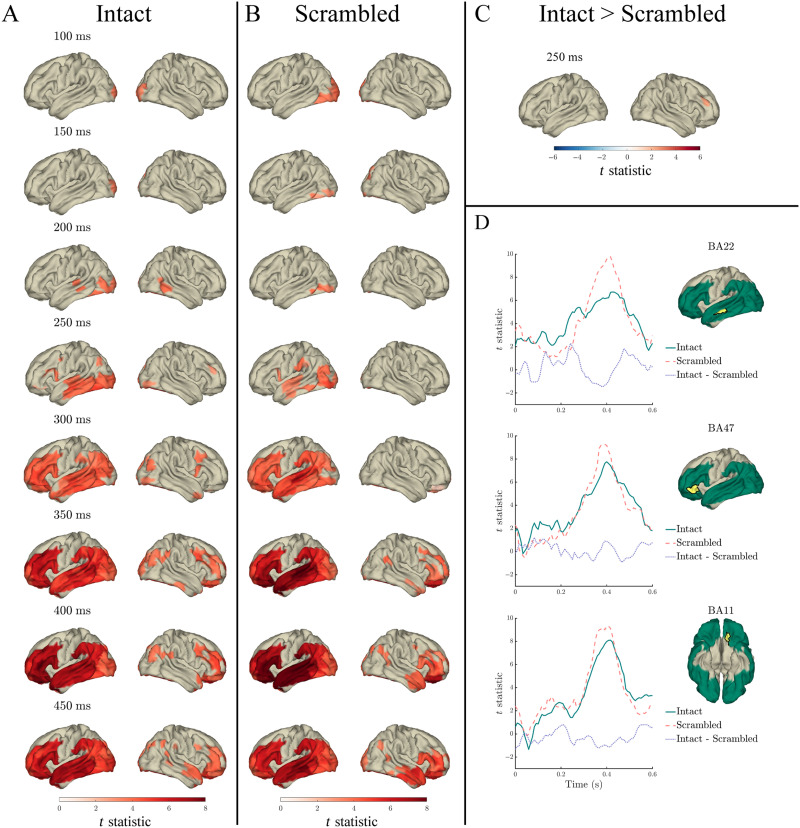
Figure 3. .
Effects of lexical frequency in the response to content words: Surface plots of t statistics (averaged over 50 ms time windows centred at the indicated latencies, for visualisation) quantifying the difference in variance explained by lexical frequency (log10 transformed), beyond that explained by index, surprisal, entropy, and length, in intact sentence compared to random permutation models (panel A; p < 0.05 one-sided, corrected), scrambled sentence compared to random permutation models (panel B; p < 0.05 one-sided, corrected), and intact compared to scrambled sentence models (panel C; p < 0.05 two-sided, corrected). Parcels for which no time point was significant during the 50-ms time bin are masked. Panel D: Time courses of t statistics for intact (solid green line) and scrambled (dashed red line) sentence models compared to random permutation models, and intact compared to scrambled sentence models (dotted purple line) for subparcels of BA22, BA47, and BA11 (highlighted in yellow on adjacent surface plots). ROIs entered into statistical analyses are illustrated as green shaded area on surface plots.

