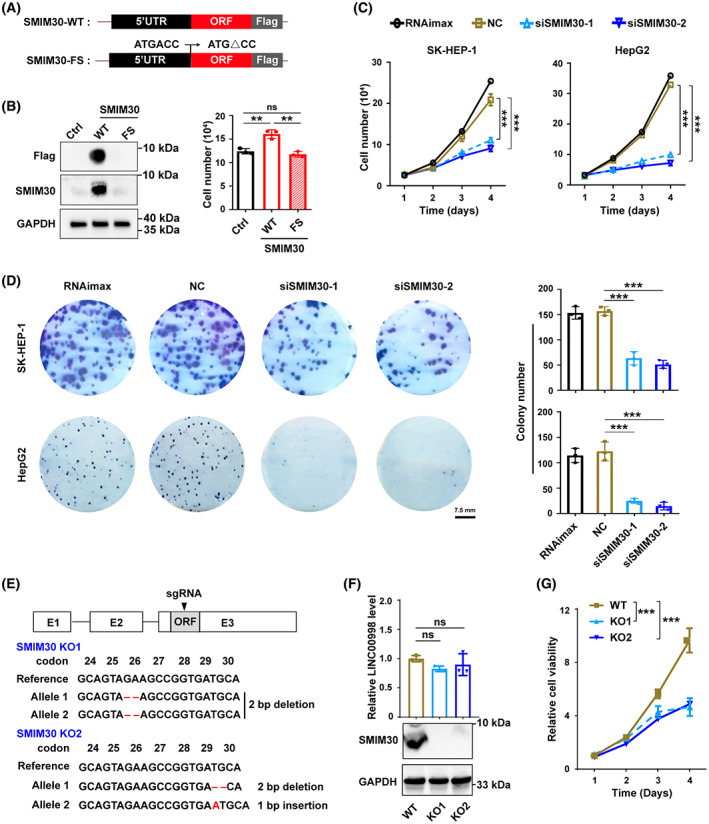
Fig. 2.

SMIM30 promotes proliferation of tumor cells in vitro. (A) Schematic showing the expression vectors of pCDH‐SMIM30‐WT‐flag (wildtype SMIM30) and pCDH‐SMIM30‐FS ‐flag (frameshift mutant SMIM30). (B) Ectopic expression of SMIM30 promoted hepatoma cell growth. SK‐HEP‐1 cells stably expressing wildtype (WT) or frameshift mutant (FS) SMIM30 or control (ctrl) were cultured in a 24‐well plate for 2 days before Western blotting (left), or cultured for 4 days before counting the cells (right). (C) SMIM30 knockdown inhibited the growth of hepatoma cells in vitro. SK‐HEP‐1 or HepG2 cells were transfected with NC or siSMIM30, then cultured for the indicated time periods before counting the cells. (D) SMIM30 knockdown inhibited the colony formation of hepatoma cells. SK‐HEP‐1 or HepG2 cells were transfected with the indicated siRNA for 48 h, then reseeded at low density in a 6‐well plate for 12 (SK‐HEP‐1) or 14 (HepG2) days before counting the colonies. RNAimax, cells exposed to Lipofectamine RNAiMAX without RNA duplex; NC, negative control of RNA duplex; siSMIM30‐1 and siSMIM30‐2, siRNAs targeting different regions of SMIM30 mRNA. Scale bar, 7.5 mm. (E) Construction of SMIM30 knockout SK‐HEP‐1 sublines. Top, scheme of the sgRNA and its targeting region (shown in black triangle). Bottom, sequence analysis of genomic DNA of the two SMIM30 KO cell lines (SMIM30 KO1 and KO2). Deletion or insertion of 1–2 base pairs resulted in frameshift mutation of SMIM30 ORF when translating. (F) SMIM30 peptide was knockout with retaining of LINC00998 RNA expression in the KO cell lines. The LINC00998 RNA and SMIM30 protein levels in the KO cells were detected by qPCR (upper) and Western blotting (lower), respectively. Parental SK‐HEP‐1 cells with wildtype SMIM30 were used a control (WT). (G) SMIM30 deficiency decreases cell viability. The SMIM30 WT and KO cell lines were seeded at low density in a 24‐well plate, then subjected to cell viability analysis using Alarma‐blue assay at the indicated time points. For B–D and F, G, data are represented as mean ± SEM of three independent repeats. P values were derived by one‐way ANOVA (B, D, and F) or two‐way ANOVA (C, G). ns, not significant; **P < 0.01; ***P < 0.001.
